Keyword
Global / Oceans | Indian Ocean
329 record(s)
Type of resources
Topics
Keywords
Contact for the resource
Provided by
Formats
Update frequencies
Status
draft
-
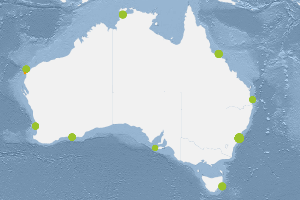
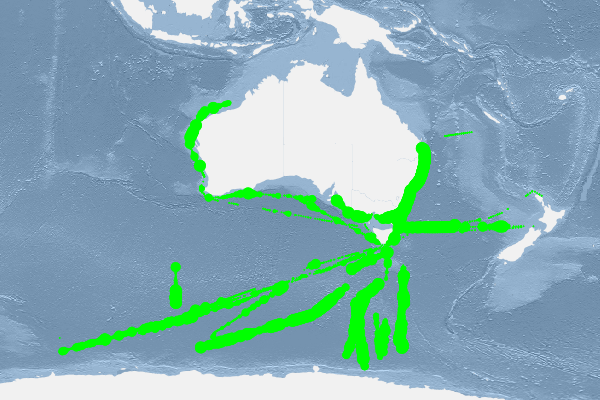
This dataset contains data collected by the Australian Continuous Plankton Recorder (AusCPR) survey and is funded by IMOS (Ships of Opportunity sub-facility) and CSIRO. The aims of the AusCPR survey are to: * map plankton biodiversity and distribution * develop the first long-term plankton baseline for Australian waters * document plankton changes in response to climate change * provide indices for fisheries management * detect harmful algal blooms * validate satellite remote sensing * initialise and test ecosystem models. The survey conducts repeat tows in the GBR, the East Australian Current and down to the Southern Ocean Time Series Mooring (SOTS). Other routes are conducted on an adhoc nature around Australia. The dataset also contains phytoplankton data from the UTAS / AAD led Southern Ocean CPR (SOCPR) project which is also funded by IMOS. The datasets available in this collection include Phytoplankton Colour Index (an estimate of chlorophyll in the water), phytoplankton abundance, zooplankton abundance and a biomass index from AusCPR and phytoplankton abundance from SOCPR. This data are freely available through the AODN portal: https://portal.aodn.org.au. This data is freely available but please acknowledge all relevant parties, as detailed in acknowledgement section.
-

This dataset comprises the phytoplankton abundance and biovolume estimates as part of a broader sampling program carried out at the Southern Ocean Time Series, a facility within the Integrated Marine Observing System (IMOS). The primary focus is sustained observing of ocean properties and processes important to climate, carbon cycling, and ocean productivity. Regular phytoplankton samples are collected at approximately 14 day intervals (exact intervals and seasonal coverage dependent on deployment length). The moorings are serviced annually, at which time the existing moorings are recovered and new moorings are deployed. Water samples from within the surface mixed-layer are collected at pre-programmed intervals using a Remote Access Sampler, in pairs about 1 hour apart. One sample in each pair is preserved for phytoplankton community composition by microscopy, and the other sample is preserved and used for accompanying chemical analysis of nutrients, total dissolved inorganic carbon (DIC) and alkalinity. Each sample is collected from within the surface mixed-layer at 32 m depth (2010 - 2017) or 5 m depth (2018-current) depending on the design of the mooring surface assembly and instrumentation. Typically a maximum of 24 samples are collected over an annual deployment cycle. The samples collected are analysed for: 1. Community composition / abundance (cells/L) 2. calculated biovolume (um3/L). Protocols for the phytoplankton time-series are described in Eriksen et al (2018), and the annual sample reports for each deployment. Data storage and access is planned to be interoperable with other national and international programs through the IMOS Infrastructure. Station metadata can be found through this resource. Data is available freely via the AODN portal: https://portal.aodn.org.au. As the taxonomic resolution of the data has changed over time, due to continual training, it is important that users refer to the change log tables included in your data download. These will provide information on the validity of the taxa, from what date we have been identifying certain taxa etc. Classification fields may be blank depending on the level to which that taxa has been identified, i.e. if only identified to family, genus and species will be blank.
-

AusCPR: Phytoplankton Abundance. The Australian Continuous Plankton Recorder (AusCPR) survey is a joint project between CSIRO Oceans and Atmosphere (O&A) and the Australian Antarctic Division (AAD) to measure plankton communities as a guide to the health of Australia's oceans. The phytoplankton abundance data are analysed as per Richardson et al 2006. Phytoplankton are usually counted from water samples after settling but in the CPR analysis we count the phytoplankton in situ. With CPR samples, the phytoplankton is captured by the mesh and are caught by the silk strands, by phytoplankton mucilage, and/or by other organisms on the silk. It is thus possible to see the phytoplankton cells directly on the mesh. In essence, the phytoplankton is already concentrated. Washing the phytoplankton off the silks to count in the standard manner may result in loss of or damage to cells before analysis. It is advised that anyone using the data should first read this methodology or contact the project contact person. The aims of the AusCPR survey are to: * map plankton biodiversity and distribution * develop the first long-term plankton baseline for Australian waters * document plankton changes in response to climate change * provide indices for fisheries management * detect harmful algal blooms * validate satellite remote sensing * initialise and test ecosystem models. Servicing and maintenance of the CPRs and analysis of the samples for the AusCPR survey will be carried out by staff based at the O&A laboratories in Queensland and at the AAD in Hobart. The project was funded by the Integrated Marine Observing System (IMOS) and falls with the Ships of Opportunity facility. Data storage and access is planned to be interoperable with other national and international programs through the IMOS Infrastructure. Results from the AusCPR survey are available through the AODN portal: https://portal.aodn.org.au. For information on using the data please refer to the Richardson et al. 2006. As the taxonomic resolution of the data has changed over time, due to continual training, it is important that users refer to the change log tables included in your data download. These will provide information on the validity of the taxa, from what date we have been identifying certain taxa etc. Classification fields may be blank depending on the level to which that taxa has been identified, i.e. if only identified to family, genus and species will be blank. This data is freely available but please acknowledge all relevant parties, as detailed in acknowledgement section.
-
The CSIRO versions of the BOM (Bureau of Meteorology Australia) ocean variables temperature and 20 degree isothermal temperature depth datasets for the region covering the Pacific to the Indian ocean. Individual monthly temperature and 20° isothermal temperature depth datasets have been concatenated into single contiguous netcdf files for the time period 1980-2008 with a spatial resolution of 1° x 2° at 14 levels from 0-500m. These have also been processed to include calculated Anomaly, Climatology, and Seasonal forms, approximately 8 files totaling 475.7 MB.
-
Information relating to Australian fisheries closures imposed by AFMA (Australian Fisheries Management Authority) and gazetted through ComLaw have been collated and tabulated with mapable GIS references in an ORACLE data base. This database allows searching, viewing and GIS mapping of the Australian spatial fisheries management through time. Mapping views of fisheries closures can be created for time, fisheries and gear types. Changes in spatial management through time will be mapable using a time-series of mapping views. The data is currently complete for the time-period of 2005 to Feb 2013. It is intended to continue this records as new gazettes are released as part of annual stock assessment updates. Non-fisheries closures (MPA, CMR) are also intended to be included but this is dependent on continued funding and demand for their use. Disclaimer: These data have been collated and made accessible for scientific research only, they may not be complete or representing the most up-to-date data. For the most recent spatial management arrangements for legal and commercial purposes, refer to the relevant current ComLaw documents or contact AFMA.
-
A team of 4 observers recorded 446 incidental seabird and cetacean sightings from Perth, Western Australia and return on the RV Investigator voyage IN2020_V01. The bulk of the observations is at Broken Ridge on the edge of the Kerguelen Plateau. Voyage details, reports and other datasets are at https://www.marine.csiro.au/data/trawler/survey_details.cfm?survey=IN2020_V01
-
Here we predict oceanographic connectivity among four geographical locations in the south west of Western Australia using hydrodynamic modelling of larval dispersal and test these predictions against genetic descriptions of population structure, population boundaries and estimates of larval migration in two co-distributed sea urchin species. Sea urchins are excellent models for characterising marine population connectivity because of their commonness, diversity of larval life histories, ease of sampling, and ecological importance as grazers in coastal benthic habitats. Our study sampled two species, Heliocidaris erythrogramma and Phylocanthius irregularis. H. erythrogramma spawns predominantly in summer and its lecithrotrophic larvae are free swimming for 3-4 days in laboratory observations. In contrast, little is known about spawning time and larval duration in P. irregularis. The south-west corner of Australia is dominated by the Leeuwin current system, the worlds only poleward-flowing western continental boundary current. The Leeuwin current (LC) is particularly strong in the late autumn and winter months and is weaker in the summer. Strong seasonal contrasts in the LC flow pattern make it possible to generate testable predictions about the predominant direction of larvae-mediated gene flow in H. erythrogramma. Comparison of genetic structure with oceanographic model predictions allowed us to make predictions about the possible larval biology of the less well characterised urchin P. irregularis.
-
The dynamics of the seasonal evolution of chlorophyll a at the continental shelf break around 32 degrees south has been investigated using a one-dimensional numerical BGC model at shelf and lagoon scales. The results show that a combination of vertical mixing associated with the Leeuwin Current and surface cooling during the winter months is responsible for the wintertime increase in chlorophyll a concentration at the shelf break (Greenwood and Soetaert, 2008). In addition, variation in the timing and magnitude of the winter increase in chlorophyll is shown, for the first time, to relate to the strength of the Leeuwin Current. A nitrogen budget for the southwest WA shelf has been derived by diagnosing the simulated fluxes of particulate and dissolved nitrogen from the 3-D model across the shelf boundaries (across two cross-shelf transects at 27S and 34.5S and across the 100 m isobath) as well as deposition and release of nitrogen at the seafloor.
-
The Science Plan for WAMSI Node 1 Project 1 characterised the south west Australian marine coastal and shelf ecosystem structure and function. Mooring progam An array of instruments was deployed four times between July2007 and May 2008, recovered after 4-6 weeks each time to download data, and service the instruments. CTD Surveys During the course of the mooring program a ctd survey of the region was completed at approximately monthly intervals using the RV Linnaeus. In the first 2 surveys a grid of 25 stations was occupied after which a further 5 stations were added to the northern end of the grid.
-
Within this experiment the blue mussel ( Mytilus edulis ) is being used as a proxy indicator to understand rates of secondary production across the continental shelf off Marmion WA. The experiment is being run at 5m depth intervals between 0 and 40 meters. Length and width of valves and wet/dry weights of tissue matter are being measured to compare condition and growth rates of individuals from different depths. Stable isotope values are obtained to compare relative C13 and N15 values, to understand if there is a difference in diet across the shelf. Water sampling is also being carried out and regular intervals whilst the experiment is deployed to investigate differences in Particulate organic matter, Chl-a, HPLC and isotope values of organic matter in the water column, to aid in explaining variation in growth and diet patterns.
