
Topic
location
5 record(s)
Type of resources
Topics
Keywords
Contact for the resource
Provided by
Years
Formats
Representation types
Update frequencies
Status
draft
-
Information relating to Australian fisheries closures imposed by AFMA (Australian Fisheries Management Authority) and gazetted through ComLaw have been collated and tabulated with mapable GIS references in an ORACLE data base. This database allows searching, viewing and GIS mapping of the Australian spatial fisheries management through time. Mapping views of fisheries closures can be created for time, fisheries and gear types. Changes in spatial management through time will be mapable using a time-series of mapping views. The data is currently complete for the time-period of 2005 to Feb 2013. It is intended to continue this records as new gazettes are released as part of annual stock assessment updates. Non-fisheries closures (MPA, CMR) are also intended to be included but this is dependent on continued funding and demand for their use. Disclaimer: These data have been collated and made accessible for scientific research only, they may not be complete or representing the most up-to-date data. For the most recent spatial management arrangements for legal and commercial purposes, refer to the relevant current ComLaw documents or contact AFMA.
-
This dataset represents Exclusive Economic Zones (EEZ) of the world. Up to now, there was no global public domain cover available. Therefore, the Flanders Marine Institute decided to develop its own database. The database includes two global GIS-layers: one contains polylines that represent the maritime boundaries of the world countries, the other one is a polygon layer representing the Exclusive Economic Zone of countries. The database also contains digital information about treaties. Please note that the EEZ shapefile also includes the internal waters of each country http://www.marineregions.org/eezmethodology.php
-
CMAR has conducted a number of stock assessment surveys for finfish, beche-de-mer and trochus on the reefs of Torres Strait. During the course of the suveys, habitat data was also collected albeit at a coarser level of taxonomic resolution. The primary objective of this study was to characterise the reefs of Torres Strait in terms of the biological and habitat data collected during these surveys and to relate the nature of the reefs to the available physical data. Information collated for this study included comprehensive datasets on reef fish, beche-de-mer and seagrass; most of which was identified to species level. Information on corals and algae was based on visual estimates of percentage cover morphotypes. Little data on the other reef biota was collected. SOURCE_DATASET CRUISE_ID CRUISE_NAME CRUISE_YEAR RRI1 HE01 Reef Resource Inventory HE01 1995 RRI2 HE02 Reef Resource Inventory HE02 1995 WR95 WRS Warrior survey 1995 1995 RRI3 JK01 Reef Resource Inventory JK01 1996 RRI4 JK02 Reef Resource Inventory JK02 1996 WR96 WRS Warrior survey 1996 1996 WR98 WRS Warrior survey 1998 1998 WR00 WRS Warrior survey 2000 2000 ETS2 ETS2 East Torres Strait 2002 2002 WE02 WRS Warrior survey 2002 2002 WR04 WRS Warrior survey 2004 2004 ETS5 ETS5 East Torres Strait 2005 2005
-
This product represents the predicted spatial patterns of selected temperate shark and ray species abundance. Species selection was based on ecological risk assessments, threatened species listings and data availability. The maps are based on existing CSIRO National Fish Collection maps, supplemented with fishery catch data, independent survey data and the expert knowledge of 20 shark and ray experts from the region. Structure equates to total species distribution, core distribution – an estimate of where 90% of the population will occur and where possible, nursery areas. The product can be used to identify movement corridors, breeding and feeding areas that overlap between species. This allows managers to identify areas of overlap that are of key conservation value to the species of interest.
-
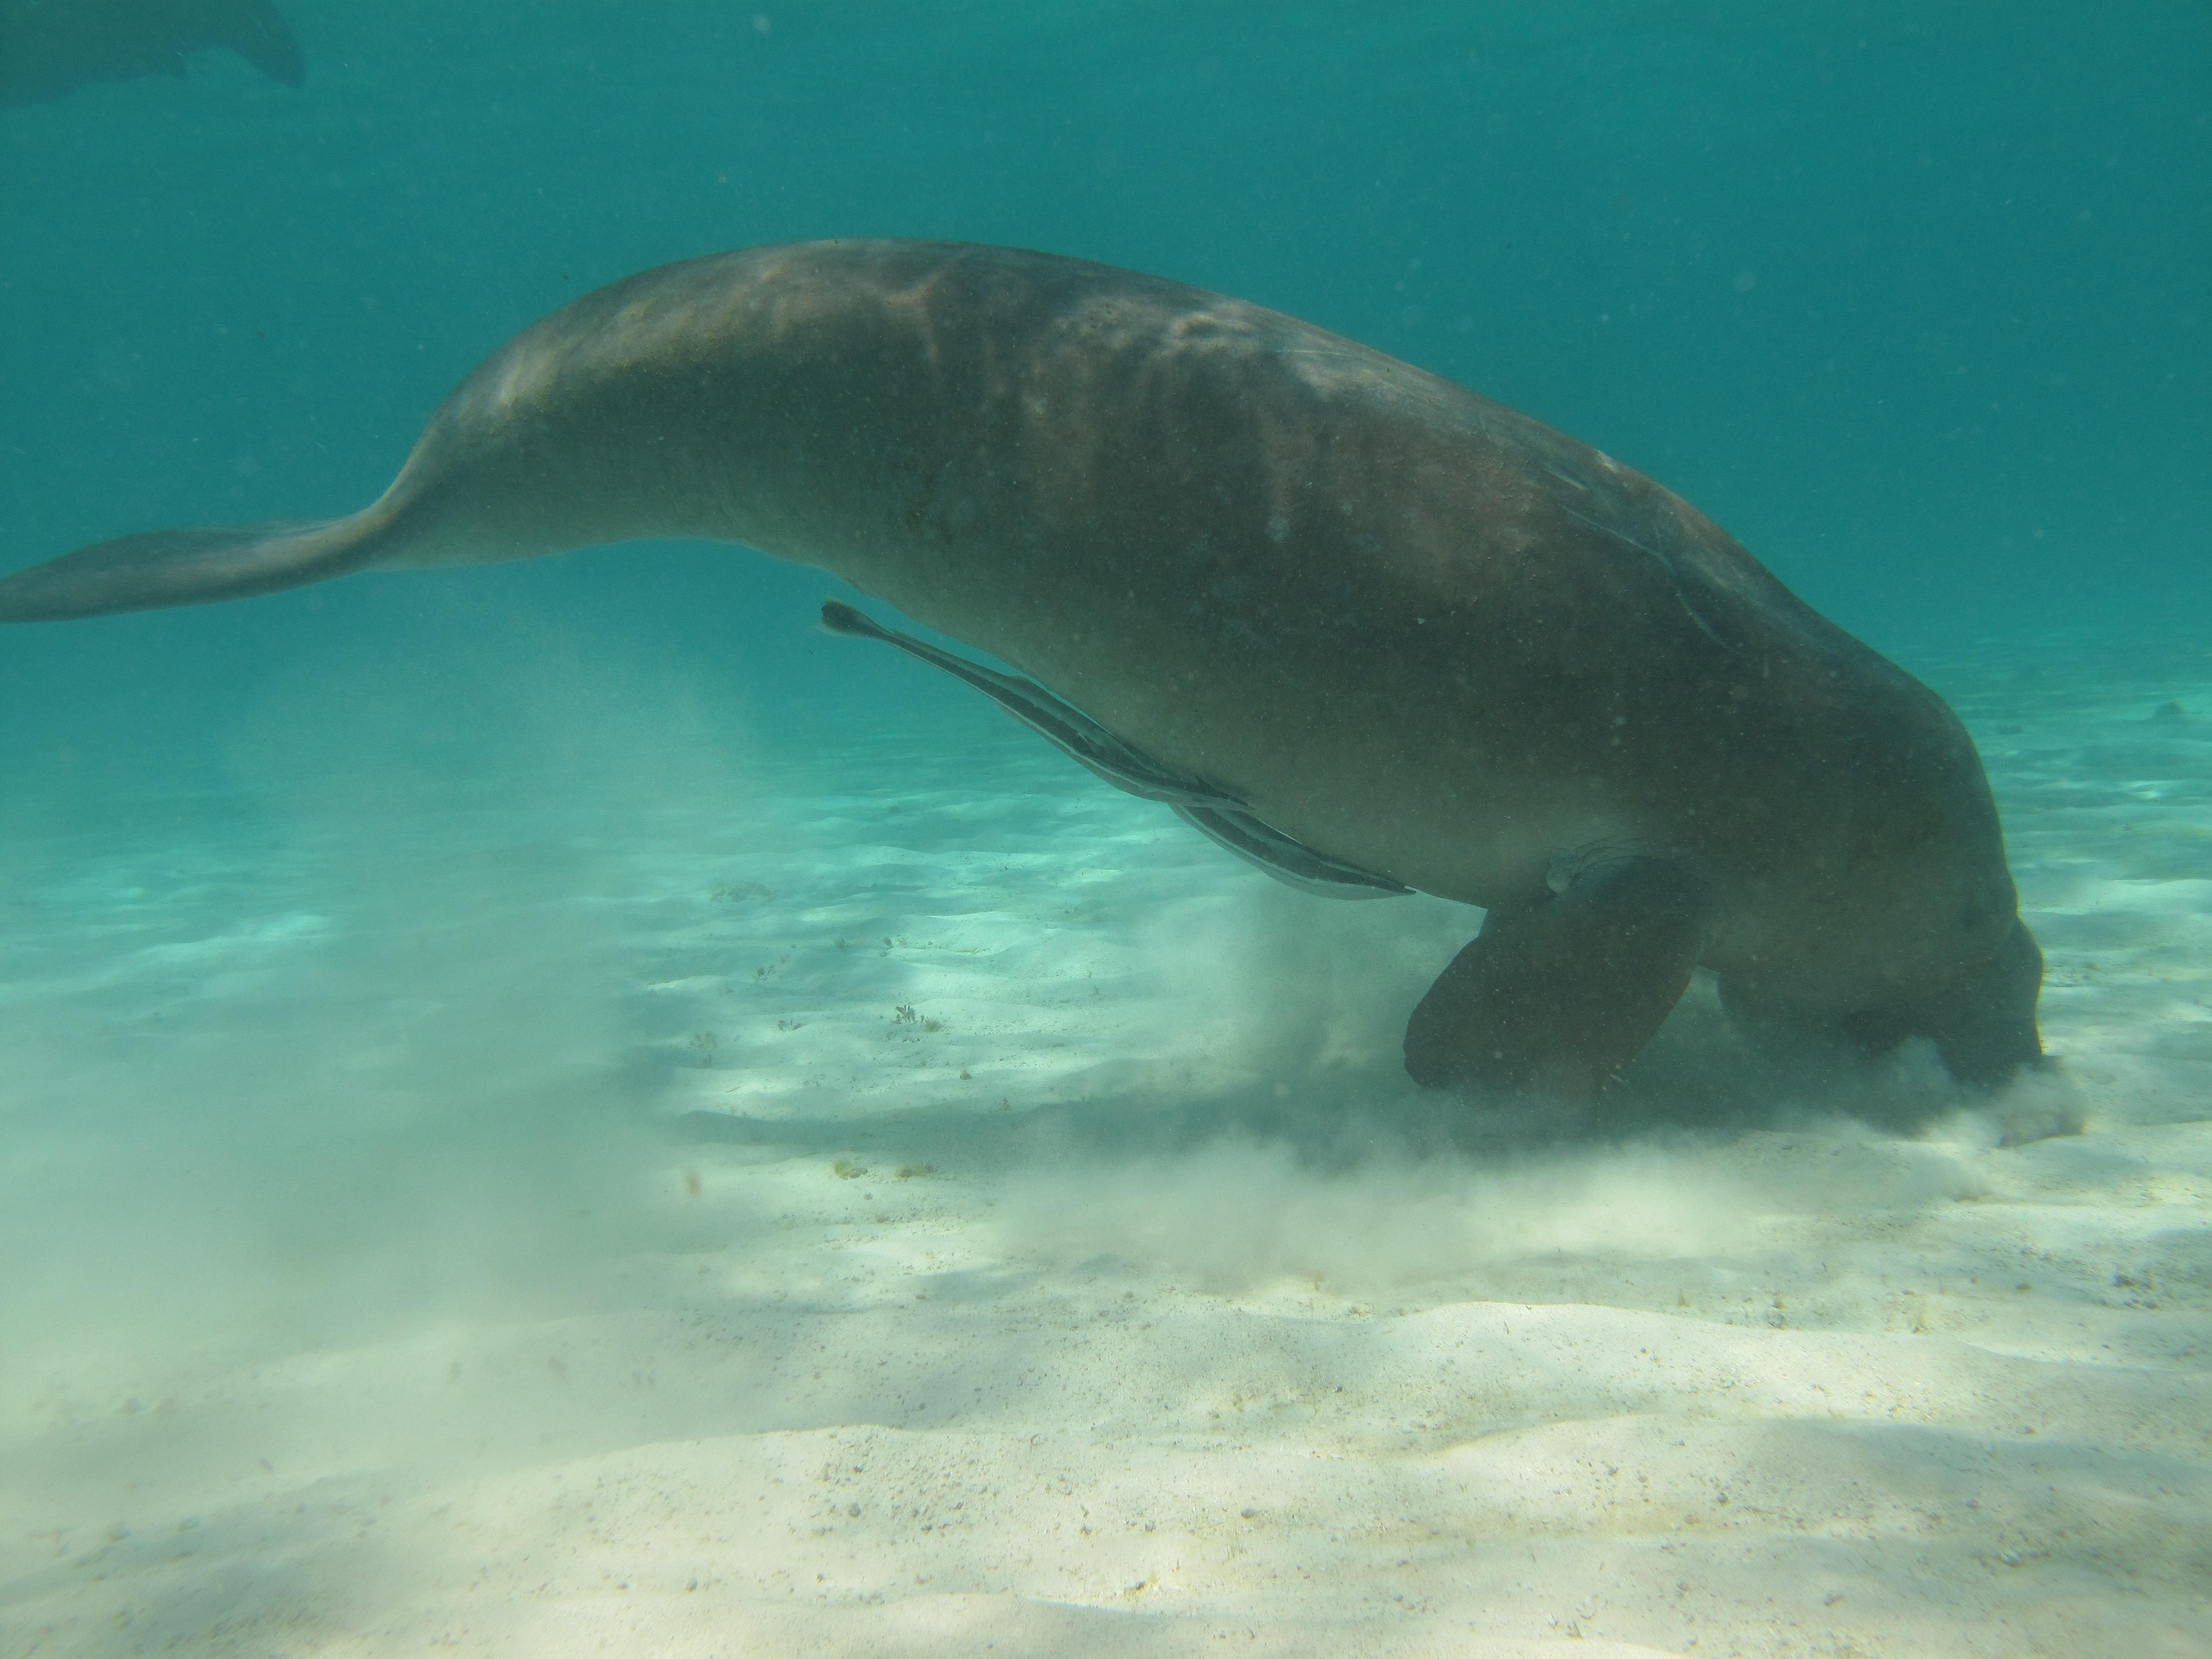
Dugongs (Dugong dugon) are listed as vulnerable on the IUCN Red List of Threatened species and as other specially protected fauna in WA under Schedule 7 of the Wildlife Conservation (Specially Protected Fauna) Notice 2015). Gaps in our knowledge in Western Australia include having a good understanding of the species’ distribution, abundance and high use areas across the northwest. This 3-year project (2014-2017) integrated Indigenous knowledge and scientific observations from field surveys to better understand the distribution, abundance and movements of dugong in the Kimberley region. The data collected also provides a baseline for future monitoring and management. This medata record relates to raw and processed aerial survey data of marine fauna collected between 21st September 2015 and 8th October 2015 in Kimberley coastal waters to the 20m bathymetry line, comprising dugongs (Dugong dugon), Australian snubfin dolphins (Orcaella heinsohni), other dolphins (bottlenose, spinners, false killer whales), humpback whales (Megaptera novaeangliae) and large, mostly green turtles (Chelonia mydas). The WA Department of Biodiversity Conservation and Attractions (DBCA, ex-DPaW) and CSIRO provided additional resources to extend the North Kimberley dugong aerial survey boundary westwards (Broome to just past Port Hedland) to cover the South Kimberley-Pilbara coastal regions, to close the last remaining knowledge gap of the dugong distribution and abundance in Australia. This additional survey was completed in May 2017. Data from a trial movement study undertaken between 1-18th August 2016 also forms part of this metadata record. Five dugongs were tagged with Telonics manatee/dugong tags. GPS and ARGOS satellite detection locations and dive data were downloaded weekly from the ARGOS web site.