
Keyword
Nephelometers
137 record(s)
Type of resources
Topics
Keywords
Contact for the resource
Provided by
Formats
Update frequencies
Status
draft
-
The CSIRO Bayside Air Quality Station datasets contain measurements of important urban air pollutants for the period of June 2004 to the present day measured in the atmosphere at the CSIRO Aspendale measuring station. There are variables for both chemical (gases such as carbon monoxide(CO), nitrogen oxides (NO, NO2, NOx), sulfur dioxide(SO2) & ozone(O3)) and physical properties (particulate mass measurements: size<10µm(Pm10), size<2.5µm(Pm2.5), size<100nm(UFP)). Variable data is logged on a minutely basis and is available in daily-average annual and hourly-average monthly excel spreadsheet formats. The Bayside Air Quality Station is located at CSIRO Marine and Atmospheric Research (CMAR) Aspendale, Victoria (38° 01' 41" South, 145° 01' 48" East)
-
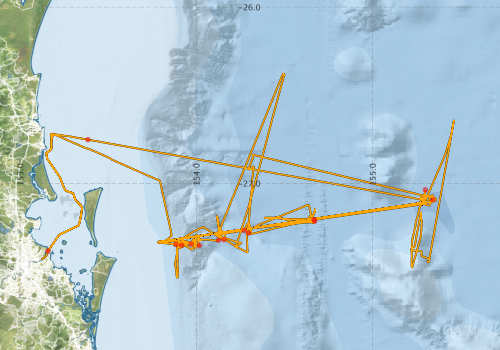
This record describes the data (CTD, Dissolved Oxygen, Transmissometer, PAR, ECO Triplet, Nitrate, Fluorescence and LOPC) collected using the towed TRIAXUS platform on Investigator voyage IN2015_V01, titled: "IMOS Southern Ocean Time Series automated moorings for climate and carbon cycle studies southwest of Tasmania." The voyage took place between March 21 and March 30, 2015 departing from Hobart (TAS) and arriving in Hobart. CTD, Dissolved Oxygen, Transmissometer, PAR, and ECO Triplet have been processed and are made available via the links below. The collected data were subsequently processed and archived within the CSIRO Oceans and Atmosphere (O&A) Information and Data Centre (IDC) in Hobart. Additional information regarding this dataset may be contained in the Voyage Summary and the Data Processing Report.
-
This record describes the Conductivity-Temperature-Depth (CTD) data collected from the Marine National Facility RV Investigator voyage IN2016_V02 Titled: "SOTS: Southern Ocean Time Series Automated Moorings for Climate and Carbon Cycle Studies Southwest of Tasmania". The voyage took place between the 13th March to 16th of April, 2016 departing Hobart (TAS) and returning to Hobart (TAS). Data for 40 deployments were acquired using the Seabird SBE911 CTD 20, fitted with 24 ten litre bottles on the rosette sampler. Sea-Bird-supplied and O&A Calibration Facility calibration factors were used to compute the pressures and preliminary conductivity values. CSIRO calibrations were applied to the temperature data. The data were subjected to automated QC to remove spikes and out-of-range values. The final conductivity calibration was based on a single deployment grouping. The final calibration from the secondary sensor had a standard deviation (S.D) of 0.00138 PSU, well within our target of ‘better than 0.002 PSU’. The standard product of 1dbar binned averaged were produced using data from the primary sensors. The dissolved oxygen data calibration from the secondary sensor was used for the final calibration. The fit had a S.D. of 0.792 uM. The agreement between the CTD and bottle data was good. The Biospherical photosynthetically active radiation (PAR), C-Star transmissometer and the Wetlabs ECO chlorophyll and scattering sensors were also installed on the auxiliary A/D channels of the CTD. The lowered ADCP was also attached to the package, logging internally during each cast. The collected data were subsequently processed and archived within the CSIRO Oceans and Atmosphere (O&A) Information and Data Centre (IDC) in Hobart. Additional information regarding this dataset may be contained in the Voyage Summary and the CTD Data Processing Report.
-
This record describes the Conductivity-Temperature-Depth (CTD) data collected from the Marine National Facility RV Investigator voyage IN2016_V05, titled: "The Great Barrier Reef as a significant source of climatically relevant aerosol particles." The voyage took place between September 28 and October 24, 2016 departing from Brisbane (QLD) and arriving in Brisbane. Data for 62 deployments were acquired using the Seabird SBE911 CTD 21 and CTD 20, fitted with 24 twelve-litre bottles on the rosette sampler. Seabird-supplied calibration factors were used to compute the pressures and preliminary conductivity values. CSIRO-supplied calibrations were applied to the temperature data. The data were subjected to automated QC to remove spikes and out-of-range values. The final conductivity calibration was based on a single deployment grouping. The final calibration from the primary sensor had a standard deviation (SD) of 0.0014061 PSU, well within our target of ‘better than 0.002 PSU.’ The standard product of 1 dBar-binned averages were produced using data from the primary sensors. The dissolved oxygen data calibration fit had a SD of 0.67142 µM. The agreement between the CTD and bottle data was good. Altimeter, Photosynthetically Active Radiation (PAR) sensor, Colored Dissolved Organic Matter (CDOM) sensor, Fluorometer, Transmissometer, Nephelometer, and Nitrate sensor were also installed on the auxiliary A/D channels of the CTD. The collected data were subsequently processed and archived within the CSIRO Oceans and Atmosphere (O&A) Information and Data Centre (IDC) in Hobart. Additional information regarding this dataset may be contained in the Voyage Summary and the CTD Data Processing Report.
-
This record describes the Conductivity-Temperature-Depth (CTD) data collected from the Marine National Facility RV Investigator voyage IN2016_T01, titled: "Continuity of Australian terranes into Zealandia: towards a geological map of the east Gondwana margin". The voyage took place from Laukota (Fiji) to Hobart (TAS) between June 30 and July 14, 2016. Data for 13 deployments were acquired using the Seabird SBE911 CTD 20, fitted with 36 twelve litre bottles on the rosette sampler. CSIRO supplied calibrations were applied to the temperature, conductivity, oxygen, and pressure data. The data were subjected to automated QC to remove spikes and out-of-range values. During cast 1, a communications error occurred at a depth of 250m (alarm on the deck unit) and the CTD was recovered. All other casts proceeded without issue. The calibrations derived from bottle samples from subsequent casts were applied to cast 1. There were no changes to the sensor package for the duration of the voyage. The final calibration from the secondary sensor for casts 2-13 had a standard deviation (S.D) of 0.0012559 PSU, well within our target of ‘better than 0.002 PSU’. The final calibration from the secondary dissolved Oxygen sensor for casts 2-13 had a standard deviation (S.D) 0.65093 uM/l. The agreement between the CTD and bottle data was good. The standard product of 1 dbar binned averaged were produced using data from the secondary temperature and conductivity sensors, and the secondary Oxygen sensor. A Fluorometer, Transmissometer, and altimeter were also installed and logged on the auxiliary A/D channels of the CTD. The collected data were subsequently processed and archived within the CSIRO Oceans and Atmosphere (O&A) Information and Data Centre (IDC) in Hobart. Additional information regarding this dataset may be contained in the Voyage Summary and the CTD Data Processing Report.
-
This record describes the Conductivity-Temperature-Depth (CTD) data collected from the Marine National Facility RV Investigator voyage IN2018_V07, titled: "SOTS: Southern Ocean Time Series automated moorings for climate and carbon cycle studies south west Tasmania; The voyage took place from Hobart (TAS) to Hobart between August 20 and August 24, 2018. Data for 1 deployment was acquired using the Seabird SBE911 CTD unit 24, fitted with 36 twelve litre bottles on the rosette sampler. Sea-Bird-supplied calibration factors were used to compute the pressures and preliminary conductivity values. CSIRO -supplied calibrations were applied to the temperature data. The data were subjected to automated QC to remove spikes and out-of-range values. The final conductivity calibration was based on a single deployment grouping. The final calibration from the primary sensor had a standard deviation (S.D) of 0.0011658 PSU, within our target of ‘better than 0.002 PSU’. The standard product of 1dbar binned averaged were produced using data from the primary conductivity and secondary oxygen sensors. The dissolved oxygen data calibration fit had a S.D. of 0.33778 uM. The agreement between the CTD and bottle data was good. A Biospherical photosynthetically active radiation (PAR) meter, Seapoint Turbidity Meter (Nephelometer) and a Chelsea Fluorometer were also installed on the auxiliary A/D channels of the CTD. The collected data were subsequently processed and archived within the CSIRO Oceans and Atmosphere (O&A) Information and Data Centre (IDC) in Hobart. Additional information regarding this dataset may be contained in the Voyage Summary and the CTD Data Processing Report.
-
This record describes the Conductivity-Temperature-Depth (CTD) data collected from the Marine National Facility RV Investigator voyage IN2017_V01 titled: "Interactions of the Totten Glacier with the Southern Ocean through multiple glacial cycles." The voyage took place from Hobart (TAS) to Hobart between the 14th January and 5th March, 2017. Data for 33 deployments were acquired during this voyage using a Seabird SBE911 CTD, fitted with 36 twelve litre bottles on the rosette sampler. Casts 1-10, 13 – 33 were acquired using the Seabird SBE911 CTD unit 20, and casts 11 and 12 were acquired using the Seabird SBE911 CTD unit 22. CTD and sensors were changed in efforts to remediate sensor issues. CSIRO -supplied calibration factors were used to compute the pressures, and preliminary temperature and conductivity values. The data were subjected to automated QC to remove spikes and out-of-range values. Processing was completed using CapPro processing software, version 2.9. For the duration of the voyage significant spikes were observed across all recorded sensor channels. Investigation strongly suggests electrical interference was the cause of the data spikes, as mitigation measures have alleviated the issue. Care was taken in post processing to remove the spikes while maintaining true data features. The nature of the spiking was primarily extreme values persisting for a single scan, which were suitably detected and flagged by evaluating the second-difference of the data. An additional filter was also applied to the data which evaluated the median and standard deviation of the conductivity over a moving window, which was used to detect extreme changes in the sensor values characteristic of the noise induced spikes. The final conductivity calibration was based on two deployment groupings, due to sensor changes during the voyage. The final calibration for casts 1-13 from the secondary sensor had a standard deviation (S.D) of 0.0010393 PSU, within our target of ‘better than 0.002 PSU’. The final calibration for casts 14-33 from the secondary sensor had a standard deviation (S.D) of 0.0020084 PSU. The standard product of 1dbar binned averaged were produced using data from the secondary sensors. The final Oxygen calibration from the primary sensor had a S.D of 0.85991 uM. The agreement between the sensor and bottle data was good. Both Oxygen sensors calibrated closely. The Biospherical photosynthetically active radiation (PAR), Wetlabs Transmissometer, the Wetlabs ECO chlorophyll, and O&A IMU sensors were also installed on the auxiliary A/D channels of the CTD. The collected data were subsequently processed and archived within the CSIRO Oceans and Atmosphere (O&A) Information and Data Centre (IDC) in Hobart. Additional information regarding this dataset may be contained in the Voyage Summary and the CTD Data Processing Report.
-
This record describes the Conductivity-Temperature-Depth (CTD) data collected from the Marine National Facility RV Investigator voyage IN2018_T01 titled: "Physical and biogeochemical gradients in the East Australian Current." The voyage took place between April 6 and April 14, 2018 departing from Hobart (TAS) and arriving in Brisbane (QLD). Data for 21 deployments were acquired using the Sea-Bird SBE911 CTD 24, fitted with 36 twelve litre bottles on the rosette sampler. Sea-Bird-supplied calibration factors were used to compute the pressures and preliminary conductivity values. CSIRO -supplied calibrations were applied to the temperature data. The data were subjected to automated QC to remove spikes and out-of-range values. The Salinometer was found to have been malfunctioning and not reliably reporting results on IN2018_T01. The final conductivity calibration was based on calibrations derived on the subsequent voyage: IN2018_V03. The final calibration from the primary sensor had a standard deviation (SD) of 0.0013986 PSU for the primary and 0.0014150 PSU for the secondary, well within our target of ‘better than 0.002 PSU’. The standard product of 1 decibar binned averaged were produced using data from the primary sensors with secondary sensors included with the suffix ‘_2’. The dissolved oxygen data calibration fit had a SD of 0.70186 uM for the primary and 0.81698 uM for the secondary. The agreement between the CTD and bottle data was good. Fluorometer, Altimeter, Transmissometer and PAR sensors were also installed on the auxiliary A/D channels of the CTD. The collected data were subsequently processed and archived within the CSIRO Oceans and Atmosphere (O&A) Information and Data Centre (IDC) in Hobart. Additional information regarding this dataset may be contained in the Voyage Summary and the CTD Data Processing Report.
-
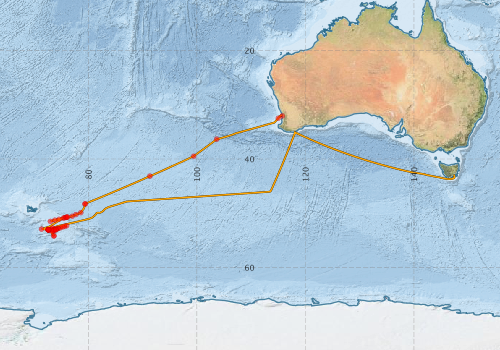
This record describes the Conductivity-Temperature-Depth (CTD) data collected from the Marine National Facility RV Investigator voyage IN2016_V01, titled: 'HEOBI: Heard Earth-Ocean-Biosphere Interactions' which departed Fremantle on the 8th January 2016 and returned to Hobart on the 27th February 2016. Data for 55 deployments were acquired using the Seabird SBE911 CTD unit 20, fitted with 24 twelve litre bottles on the rosette sampler. Sea-Bird-supplied calibration factors were used to compute the pressures and preliminary conductivity values. CSIRO -supplied calibrations were applied to the temperature data. The data were subjected to automated QC to remove spikes and out-of-range values. The final conductivity calibration was based on a single deployment grouping. The final calibration from the primary sensor had a standard deviation (S.D) of 0.0013449 PSU, within our target of ‘better than 0.002 PSU’. The standard product of 1dbar binned averaged were produced using data from the secondary oxygen and primary temperature and conductivity sensors. The dissolved oxygen data calibration fit had a S.D. of 0.91455uM. The agreement between the CTD and bottle data was good. A dual channel Fluorometer and an oxidation-reduction potential (ORP) sensor were also installed on the auxiliary A/D channels of the CTD. The collected data were subsequently processed and archived within the CSIRO Oceans and Atmosphere (O&A) Information and Data Centre (IDC) in Hobart. Additional information regarding this dataset may be contained in the Voyage Summary and the CTD Data Processing Report. NOTE: The netCDF variable in the binned file has the incorrect instrument data for the fluorometer. In the published data it is as follows: fluorometer:manufacturer = "Chelsea" ; fluorometer:model = "Aquatracka" ; fluorometer:serialNo = "065941001" ; fluorometer:unitNo = 2. ; The data should read: fluorometer:manufacturer = "Wetlabs" ; fluorometer:model = " FLBBRTD" ; fluorometer:serialNo = "3698" ; fluorometer:unitNo = 2. ; The actual data is unaffected.
-
This record describes the Conductivity-Temperature-Depth (CTD) data collected from the Marine National Facility RV Investigator voyage IN2016_V06 titled: "Sustained monitoring of the EAC: mass, heat and freshwater". The voyage took place between 29 October and 13 November, 2016 departing from Brisbane (QLD) and arriving in Brisbane. Data for 12 deployments were acquired using the Seabird SBE911 CTD unit 20, fitted with 24 twelve litre bottles on the rosette sampler. Sea-Bird-supplied calibration factors were used to compute the pressures and preliminary conductivity values. CSIRO -supplied calibrations were applied to the temperature data. The data were subjected to automated QC to remove spikes and out-of-range values. The final conductivity calibration was based on a single deployment grouping. The final calibration from the primary sensor had a standard deviation (S.D) of 0. 0013601 PSU, within our target of ‘better than 0.002 PSU’. The standard product of 1dbar binned averaged were produced using data from the primary sensors. The dissolved oxygen data calibration fit had a S.D. of 0. 84677 uM. The agreement between the CTD and bottle data was good. The Biospherical photosynthetically active radiation (PAR), C-Star transmissometer and the Wetlabs ECO chlorophyll and CDOM sensors were also installed on the auxiliary A/D channels of the CTD The collected data were subsequently processed and archived within the CSIRO Oceans and Atmosphere (O&A) Information and Data Centre (IDC) in Hobart. Additional information regarding this dataset may be contained in the Voyage Summary and the CTD Data Processing Report.