
cl_maintenanceAndUpdateFrequency
annually
5 record(s)
Type of resources
Topics
Keywords
Contact for the resource
Provided by
Formats
Representation types
Update frequencies
Status
draft
-
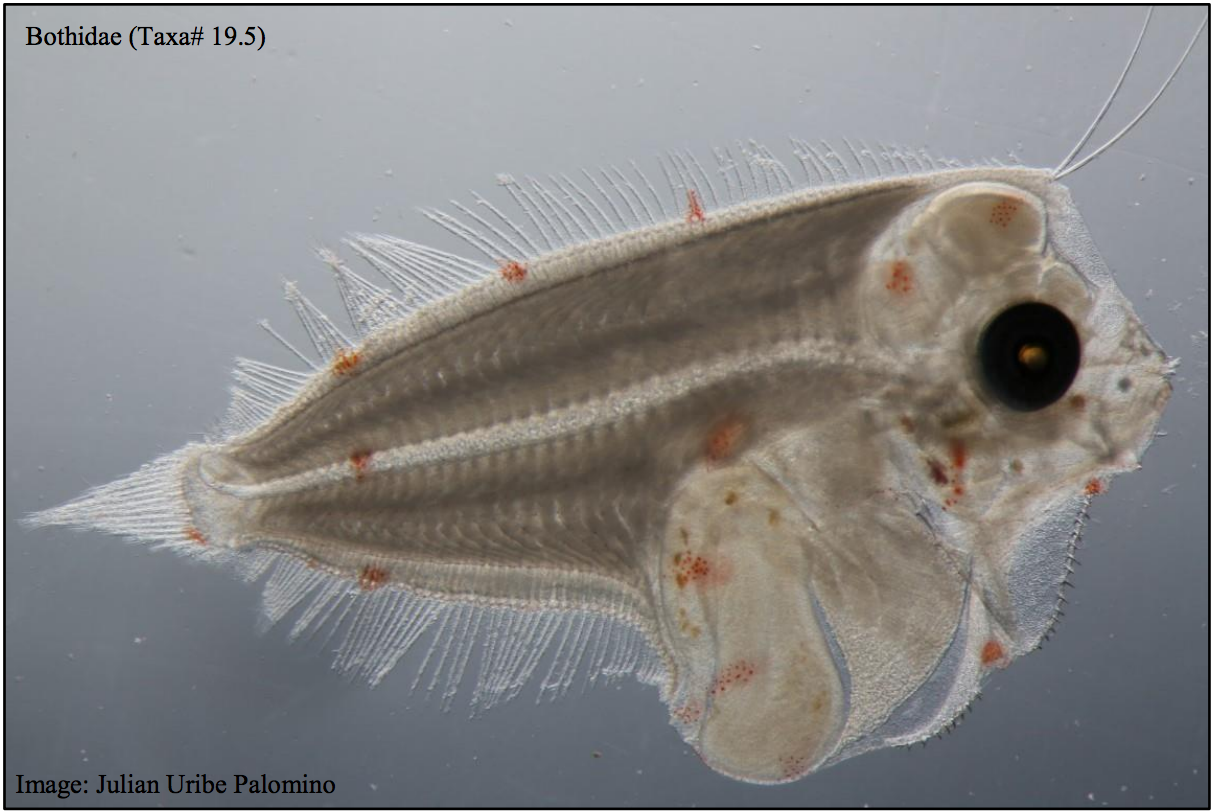
This dataset contains the ichthyoplankton data from three National Reference Stations on the east coast of Australia (North Stradbroke Island, Port Hacking, and Maria Island), and comparable historical data from eight ichthyoplankton surveys that were used to provide a longer term context: RV Sprightly (1983) RV Challenger (1989-1991) RV Franklin (1994) RV Franklin (1997-1998) RV Franklin (1998-1999) RV Southern Surveyor (2004) RV Investigator (2015) FRV Kapala (1989-1993) Refer to the published report which had the following goals: - To evaluate the value of long-term monitoring of ichthyoplankton at selected locations in the Integrated Marine Observing System (IMOS) National Reference Station (NRS) network, - To identify the potential of this monitoring for providing fishery-independent information relevant for marine fishes and their management. Note - Currently only the data from the IMOS NRS Stations have been made available.
-
This data set contains summaries of AFMA log book data on effort distribution for Commonwealth fisheries in the Australian Exclusive Economic Zone (excluding Cocos and Christmas Islands, Norfolk Island and the Sub-Antarctic Fisheries). The logbook data has been recorded and submitted to AFMA by commercial fishers. The data has been aggregated to produce summaries of total effort by gear type (summarised across fishery), over 5 year periods and at a 0.1 degree resolution where 5 boats or more operate. All effort information has been removed for areas where less than 5 boats operate and these areas are mapped to a 1 degree resolution. The 5 years periods (1996-2000, 2001-2005 and 2006-2010) correspond to State of Environment (SoE) Reporting, required under the EPBC Act 1999. The most recent reporting period (2011-14) is a four year period. Each is labelled by the years aggregated (ie 2001-2005) and the gear type (ie LLP = long line pelagic). The gear codes and aggregated fisheries and the shape file field descriptions are listed below. Notes: 1. Care needs to be taken when interpreting the fishing effort maps because in areas where there are less than 5 boats operating only the fishing footprint is displayed, consistent with the AFMA Information Disclosure Policy. The fishing footprint indicates that fishing occurred but does not provide information about the intensity of effort (number of operations etc). 2. Legal fishing by foreign flagged vessels occurred in the 1980s and early 1990s in the Australian Fishing Zone. These are shown as areas of higher effort in (i) trawl maps prior to 1990 north of Arnhem Land and (ii) pelagic longline maps up until 1997 south of Tasmania. 3. Minor line was historically recorded as a method in some of AFMA’s daily fishing logbooks, but is not in AFMAs current fishery logbooks. Minor line means trolling, or fishing using a rod or reel, handline or pole. 4. Trawl effort maps are missing Torres Strait Prawn Fishery data prior to 2004. 5. Gillnet effort maps prior to 1996 are not included due to data incompleteness. 6. Jigging data is currently incomplete and is not included. 7. Three records of Danish Seine were misreported (between 1996 and 2010) in the area of the Great Barrier Reef and have been removed. 8. Minor line was historically recorded as a method in some of AFMA’s daily fishing logbooks, but is not in AFMAs current fishery logbooks. Minor line means trolling, or fishing using a rod or reel, handline or pole. 9. Disclaimer: The data provided by AFMA may contain errors or be incomplete. AFMA makes no warranty or representation that the data is accurate or complete. Those who choose to use this data should make their own enquiries as to its accuracy and completeness and AFMA assumes no liability for any errors or omissions in the data provided, or for any decision by a person who chooses to rely on the data. ################################################# Field descriptions for shapefiles: CSQ_CODE: C-Squares code. 1 degree and 0.1 degree grids used CSQ_RESLN: C-Squares resolution of current polygon VESSELS: Number of vessels OPERATIONS: Number of operations HOURS: Effort in hours from start and end time HOOKSSET: Total hooks set NUMLINES: Number of lines deployed NETLENGTH: Gillnet Net Length Fishery Aggregations GEAR_CODE_CSIRO GEAR_CODE_CSIRO_DESCN FISHERY NAME AL Auto Longline CSF Coral Sea Fishery AL Auto Longline GHT Gillnet, Hook and Trap Fishery AL Auto Longline SEN South East Non-Trawl Fishery AL Auto Longline TUN Tuna Fishery BL Demersal Longline CSF Coral Sea Fishery BL Demersal Longline ECT Eastern Tuna & Billfish Fishery BL Demersal Longline GHT Gillnet, Hook and Trap Fishery BL Demersal Longline SEN South East Non-Trawl Fishery BL Demersal Longline SSF Southern Shark Fishery BL Demersal Longline SSG Southern Shark Gillnet Fishery BL Demersal Longline SSH Southern Shark Hook Fishery DS Danish Seine GAB Great Australian Bight Fishery DS Danish Seine SET South East Trawl Fishery DS Danish Seine VIT Victorian Inshore Trawl Fishery DS Danish Seine WDW Western Deep Water Trawl Fishery GN Gillnet ECT Eastern Tuna & Billfish Fishery GN Gillnet GHT Gillnet, Hook and Trap Fishery GN Gillnet SEN South East Non-Trawl Fishery GN Gillnet SSF Southern Shark Fishery GN Gillnet SSG Southern Shark Gillnet Fishery GN Gillnet SSH Southern Shark Hook Fishery HL Handline CSF Coral Sea Fishery HL Handline ECT Eastern Tuna & Billfish Fishery HL Handline GHT Gillnet, Hook and Trap Fishery HL Handline SEN South East Non-Trawl Fishery HL Handline SSF Southern Shark Fishery HL Handline SSG Southern Shark Gillnet Fishery HL Handline SSH Southern Shark Hook Fishery HL Handline TUN Tuna Fishery HL Handline WTB Western Tuna and Billfish HL Handline WTF Southern & Western Tuna & Billfish Fishery J Jigging SPF Small Pelagic Fishery J Jigging SQJ Southern Squid Fishery J Jigging SQD Squid Fishery J Jigging SSF Southern Shark Fishery J Jigging SEN South East Non-Trawl Fishery LLP Pelagic Longline ECT Eastern Tuna & Billfish Fishery LLP Pelagic Longline TUN Tuna Fishery LLP Pelagic Longline WTB Western Tuna and Billfish LLP Pelagic Longline WTF Southern & Western Tuna & Billfish Fishery ML Minor Line ECT Eastern Tuna & Billfish Fishery ML Minor Line WTB Western Tuna and Billfish ML Minor Line WTF Southern & Western Tuna & Billfish Fishery PB Pole & Bait TUN Tuna Fishery PB Pole & Bait ECT Eastern Tuna & Billfish Fishery PB Pole & Bait GHT Gillnet, Hook and Trap Fishery PB Pole & Bait JMF Jack Mackerel Fishery PB Pole & Bait SBT Southern Bluefin Tuna Fishery PB Pole & Bait SEN South East Non-Trawl Fishery PB Pole & Bait WTB Western Tuna and Billfish PB Pole & Bait WTF Southern & Western Tuna & Billfish Fishery PS Purse Seine ECT Eastern Tuna & Billfish Fishery PS Purse Seine EST Eastern Skipjack Fishery PS Purse Seine JMF Jack Mackerel Fishery PS Purse Seine SBT Southern Bluefin Tuna Fishery PS Purse Seine SPF Small Pelagic Fishery PS Purse Seine TUN Tuna Fishery PS Purse Seine WST Western Skipjack Fishery PS Purse Seine WTF Southern & Western Tuna & Billfish Fishery TL Trotline CSF Coral Sea Fishery TL Trotline ECT Eastern Tuna & Billfish Fishery TL Trotline GHT Gillnet, Hook and Trap Fishery TL Trotline SEN South East Non-Trawl Fishery TL Trotline TUN Tuna Fishery TR Trolling CSF Coral Sea Fishery TR Trolling ECT Eastern Tuna & Billfish Fishery TR Trolling SSF Southern Shark Fishery TR Trolling TSF Torres Strait Fishery TR Trolling WTF Southern & Western Tuna & Billfish Fishery TW Trawling CSF Coral Sea Fishery TW Trawling ECD East Coast Deepwater Trawl Fishery TW Trawling GAB Great Australian Bight Fishery TW Trawling JMF Jack Mackerel Fishery TW Trawling NPF Northern Prawn Fishery TW Trawling NWS North West Slope Trawl Fishery TW Trawling SET South East Trawl Fishery TW Trawling SPF Small Pelagic Fishery TW Trawling STR South Tasman Rise Fishery TW Trawling TSP Torres Strait Prawn Fishery TW Trawling TUN Tuna Fishery TW Trawling VIT Victorian Inshore Trawl Fishery TW Trawling WDW Western Deep Water Trawl Fishery
-
The data are records of the locations of individual fishing vessels of the Northern Prawn Fishery (NPF). The data were collected by the Australian Fisheries Management Authority with a satellite that polls transponders fitted to all fishing vessels that are registered for the NPF. The main purpose of the data is to ensure that vessels comply with fishery management directives; however, the data can also be used for research as an indicator of fishing pattern. Each data record contains a vessel identification number, vessel name, time, latitude and longitude. Two sets of speed and bearing fields are also present: the first contains instantaneous velocity measured by the transponder; the second contains velocity estimated from the poll locations. Polling intervals vary from seconds to hours depending on AFMA's operational requirements. Notes on Access: The data may only be used by CMR staff with the permission of the CMR VMS data custodian.
-
The dataset comprises GIS grids of fishing effort of the Northern Prawn Fishery (NPF) estimated from vessel monitoring system (VMS) data. The VMS is operated by the Australian Fisheries Management Authority (AFMA). It periodically records the location of each vessel in the fishery. Note that the activity of the vessel at the time is not recorded. The system's primary purpose is to monitor compliance with fishing regulations, but the data can also be used for research. To estimate fishing effort from the VMS records, we estimated the track of each fishing vessel by joining successive vessel locations with lines. We divided the track into apparent trawling and non-trawling sections (e.g. based on date, time and vessel speed), and calculated the time each trawling section spent in each cell of a GIS grid covering the managed area of the fishery. This method for estimating fishing effort from VMS data has limitations. Because a vessel may have taken a path other than a straight line between the polls, our straight line path (a) may only partially match the real path of the vessel, (b) may underestimate the length of the path traversed by the vessel, and (c) may underestimate the speed of the vessel. Note that (a) and (b) would affect which particular grid cells the trawling time was allocated to, but not the total trawling time that was added to the grid. The use of vessel speed to filter out non-trawling activity is imperfect because vessels may carry out other activities at speeds less than the maximum trawling speed.
-
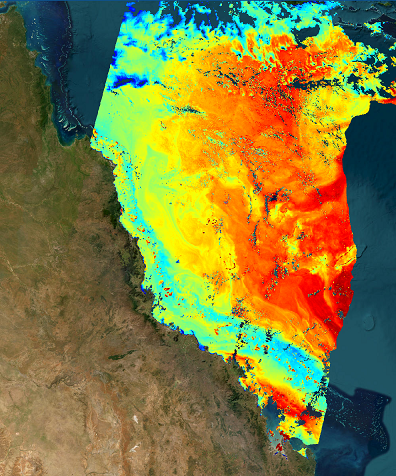
Sentinel-3 OLCI reduced resolution (approximately 1000m-pixel size) daily reprojected Level 2P above-water spectral remote sensing reflectance produced by CSIRO under eReefs Phase 5 using the FUB-CSIRO Coastal Water Processor (detailed description at https://doi.org/10.1016/j.rse.2021.112848). This product was derived from Level 2 geophysical quantities, and placed onto a regular grid using nearest neighbor resampling. Standard Level 1 quality flags have been applied to pre-mask and quality control the data (see file_version_quality_control). Additional algorithm input and output out-of-range flags (in_out_OR_combined_flags) are provided to further quality control the data. These flags have not been applied to pre-mask the data.