
Keyword
Satellites
39 record(s)
Type of resources
Topics
Keywords
Contact for the resource
Provided by
Formats
Update frequencies
Status
draft
-
Sea surface temperature data, in 1, 3, 6, 10 and 15 day composite periods, at approximately 4 km resolution processed from NOAA Advanced Very High Resolution Radiometer (AVHRR) data received at Australian Stations and transformed to the stitched archive (see related record). Temporal coverage of the data is from October 1993-June 2003 and will be extended backwards and forwards through time. The data are in netCDF files and can be viewed as graphics or downloaded as data files from http://www.marine.csiro.au/remotesensing/oceancurrents/
-
The data are records of the locations of individual fishing vessels of the Northern Prawn Fishery (NPF). The data were collected by the Australian Fisheries Management Authority with a satellite that polls transponders fitted to all fishing vessels that are registered for the NPF. The main purpose of the data is to ensure that vessels comply with fishery management directives; however, the data can also be used for research as an indicator of fishing pattern. Each data record contains a vessel identification number, vessel name, time, latitude and longitude. Two sets of speed and bearing fields are also present: the first contains instantaneous velocity measured by the transponder; the second contains velocity estimated from the poll locations. Polling intervals vary from seconds to hours depending on AFMA's operational requirements. Notes on Access: The data may only be used by CMR staff with the permission of the CMR VMS data custodian.
-
GIS grid showing sea surface temperature total means from data collected by CSIRO Remote Sensing Division from the USA's National Oceanographic and Atmospheric Administration (NOAA) satellites. This grid has been produced by CSIRO for the National Oceans Office, as part of an ongoing commitment to natural resource planning and management through the 'National Marine Bioregionalisation' project. Variations in onscreen colour representation or printed reproduction may affect perception of the contained data.
-
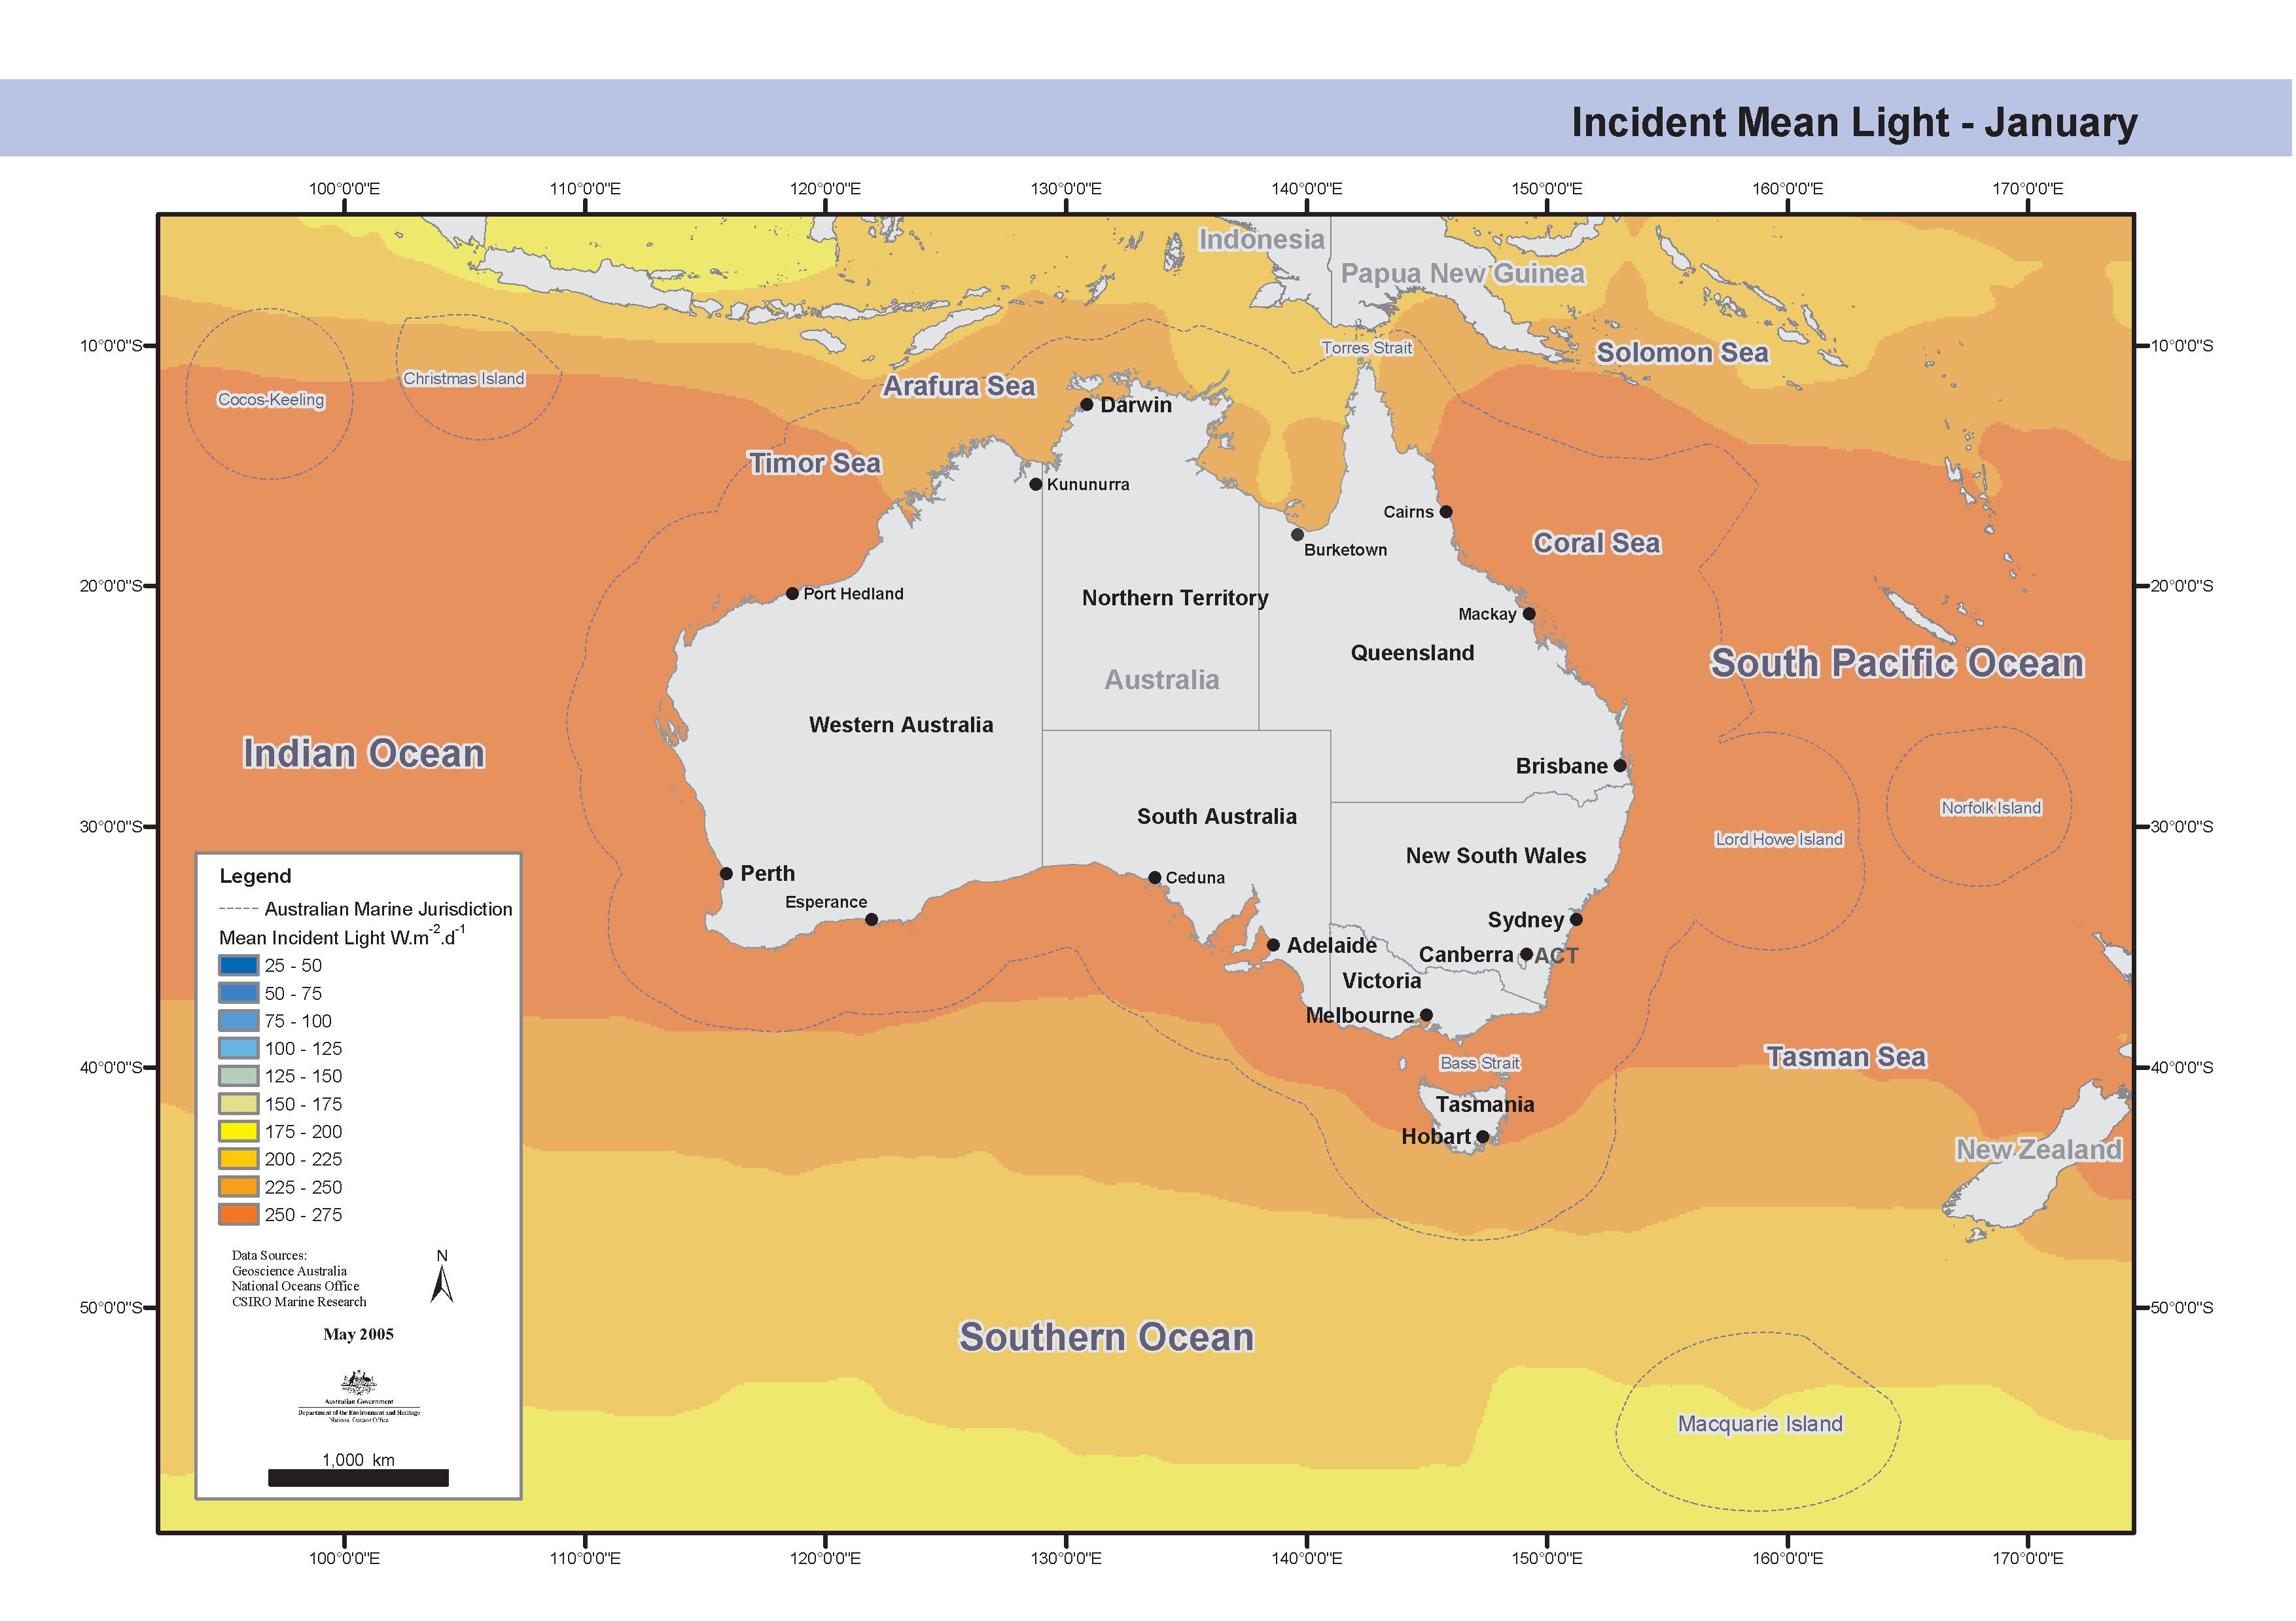
Set of maps showing the mean incident light each quarter around Australia. These maps have been produced by CSIRO for the National Oceans Office, as part of an ongoing commitment to natural resource planning and management through the 'National Marine Bioregionalisation' project.
-
Satellite altimeter data from the radar altimeter on board the European ERS-2 satellite, comprising Global (81S -> 81N) sea surface height anomalies along ground tracks which are repeated every 35 days. There are two versions of this dataset. Each version is approximately 620 Mb and the period covered is May 1995 to July 2003. This data set is also known as "ERS-2, phase A", but there are no phases B, C,... One of the versions ("cor") has had a long-wavelength correction applied. The other version ("raw") has not had this correction applied. The data was provided by Aviso/CNES in France and has been reformatted at CSIRO Marine Research in Hobart to a uniform grid spacing and format. Available on-line on the CSIRO Marine Research network; also available to outside users on request.
-
Satellite altimeter data from the radar altimeter on board the European ERS-1 satellite, phase G, comprising Global (81S -> 81N) sea surface height anomalies along ground tracks which are repeated every 35 days. The dataset (which is combined online with phase C of the same mission) is approximately 190 Mb and the period covered is March 1995 to June 1996. The data was provided by Aviso/CNES in France and has been reformatted at CSIRO Marine Research in Hobart to a uniform grid spacing and format. Available on-line on the CSIRO Marine Research network; also available to outside users on request.
-
Satellite altimeter data from the GEOSAT (U.S. Navy Geosat radar altimeter satellite) Exact Repeat Mission, comprising Global (72S -> 72N) sea surface height anomalies along ground tracks which are repeated every 17 days. The dataset is approximately 220 Mb and the period covered is November 1986 to October 1989. The data was provided by NOAA/NGS in the USA and has been processed at CSIRO Marine Research in Hobart to a uniform grid spacing and format. Available on-line on the CSIRO Marine Research network; also available to outside users on request.
-
This data set contains mapped and gridded data from TOPEX/Poseidon (NASA/CNES), Jason-1 (CNES/NASA), ERS-1, ERS-2 and Envisat (ESA). At any given time data from all available satellites is included in the mapped and gridded data product. At times only data for TOPEX/Poseidon is available. This is indicated in one of the fields in the data file. Data comes from TOPEX/Poseidon and ERS-1/2 up until about June, 2003. After that data comes from the follow-on missions - Jason-1 and Envisat. The data is on a 1 degree Mercator grid - the longitude grid spacing is always 1 degree. The latitude grid spacing is 1 degree at the equator, but gets smaller with distance from the equator. This data set is in a relatively easy to use format. The data was provided by Aviso/CNES in France and has been reformatted into a netCDF file at CSIRO Marine Research in Hobart. Available on-line on the CSIRO Marine Research network; also available to outside users on request.
-
Sea surface temperature data, in DISIMP images, from NOAA Advanced Very High Resolution Radiometer (AVHRR) data received at the ACRES station in Alice Springs. Data starts from Apr. 1991, and is calculated using an objective analysis procedure written in IDL. The images cover the Australian continent and surrounding oceans. The data are contained on CDROMs in Hobart.
-
Sea surface temperature data, in netCDF format, from NOAA Advanced Very High Resolution Radiometer (AVHRR) data, processed in Hobart by the CMR Remote Sensing Facility. The dataset includes both the Pathfinder SST daily images, and the optimal estimates (and error fields) made from them, at 10-day intervals. Data starts from Jan. 1988, and is calculated using an objective analysis procedure written in Matlab. The images cover the Australian continent and surrounding oceans. The data are contained on 7 CDROMs in Hobart.