
Topic
economy
14 record(s)
Type of resources
Topics
Keywords
Contact for the resource
Provided by
Formats
Representation types
Update frequencies
Status
draft
-
FAO Major Fishing Areas for Statistical Purposes are arbitrary areas, the boundaries of which were determined in consultation with international fishery agencies on various considerations, including (i) the boundary of natural regions and the natural divisions of oceans and seas; (ii) the boundaries of adjacent statistical fisheries bodies already established in inter-governmental conventions and treaties; (iii) existing national practices; (iv) national boundaries; (v) the longitude and latitude grid system; (vi) the distribution of the aquatic fauna; and (vii) the distribution of the resources and the environmental conditions within an area. For various historical reasons the Areas in the Pacific were not so developed, with the exception of Area 87 corresponding to the CPPS area of competence. Initiatives for closer cooperation between agencies in the interest of better data, not only in the field of tunas, have suggested that some changes are necessary to the present FAO fishing areas/boundaries in the Pacific. The boundaries of fishing areas could be modified and adjusted according to new requirements, but it is inadvisable to introduce too frequent amendments to the already established areas. Revisions to boundaries should only be introduced after consultation with all the national fishery authorities and fishery agencies concerned with the areas under revision. Unless there are other over-riding reasons, boundaries lines should be drawn along 5° lines of longitude and latitude.
-
This data set contains the location of active and decommissioned submarine petroleum pipelines in Australian waters. Data set delivered by NOPTA to CSIRO upon request. Data is made publically available by the NESP Marine Biodiversity Hub. Note: NOPTA contact Melanie Webb - melanie.webb@nopta.gov.au
-
This record describes AFMA catch and effort data for the Torres Strait Rock Lobster Fishery, held by CSIRO Marine and Atmospheric Research. A number of commercial fisheries operate within the Torres Strait for which logbook data is collected by AFMA. The rock lobster fishery comprises multiple sectors from both Australia and PNG with the two Australian sectors being a Traditional Inhabitant (TIB) sector and a non-Traditional Inhabitant (TVH) commercial sector. Data for the two Australian sectors is collected by AFMA while data for the PNG component of the fishery is collected by PNG Fisheries authorities with an annual summary (total catch) passed to AFMA at the end of each season. Rock lobster catch data also exists for a trawl fishery which operated in the Torres Strait between 1980 and 1986. For the two Australian sectors of the Torres Strait rock lobster fishery, catch reporting is compulsory only in the TVH commercial sector via a logbook program. Reporting of commercial catch from the TIB sector is currently not compulsory and any data that is reported is done on a voluntary basis through processors via a docketbook program. The docketbook system was introduced in 2004 in an attempt to collect commercial catch data from TIB fishers when they sold their catch. The docketbook program has been generally accepted well by TIB fishers since its introduction but has a number of limitations. Although the docketbook program has been successful to some extent, there are significant difficulties with data accuracy and completeness. As the program is also voluntary, not all processors participate in the program or complete records for all sales.
-
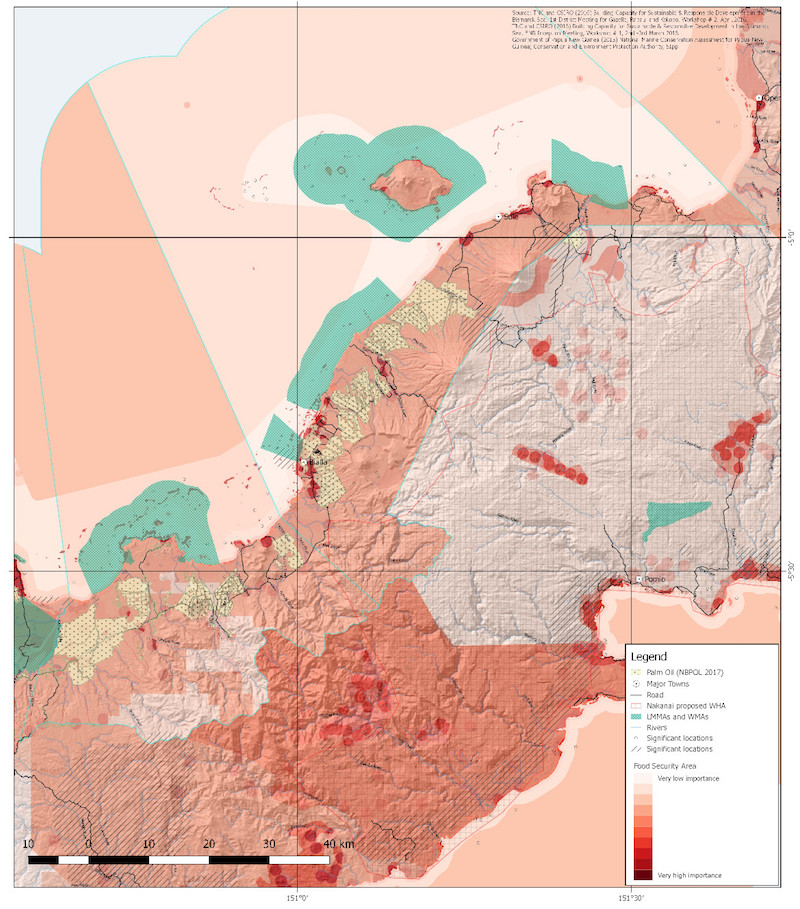
We have developed a framework for collating and presenting information on the values of marine and coastal ecosystems to relevant stakeholders for planning and decision making tasks in New Britian, Papua New Guinea. The framework includes the following design criteria: • Includes a comprehensive range of value types, including socio-cultural, economic and ecosystem values, and all four ecosystem services types (provisioning, cultural, regulating and supporting). • Has the ability to reflect the different value (scalar) contexts of local, Provincial and National stakeholders. • Is spatial, being based on ecosystem feature layers. • Has the capacity to be spatially comprehensive, by including a full range of ecosystem features in the focus area. • Does not rely on monetisation or attempt to calculate a single value (e.g. TEV), but rather relies on a plurality of values. Attempts to presents information in a transparent, relevant, replicable and credible way. Our approach is built on contemporary approaches to the valuation of ecosystems for planning and management. This includes the expression of pluralist values and appropriate consideration of scale. Pluralist values recognises that there is value in reflecting a broad range of value types when considering the value of ecosystems across ecological, socio-cultural and economic values. There are four categories of values represented in the framework: ecosystem structure and processes (biodiversity, productivity, connectivity); ecosystem regulatory functions (climate, pest, and pollution regulation; hazard protection); ecosystem goods and services supply (food, fibre and fuel); and shared social values (spiritual, aesthetic, recreation, existence values). This represents a comprehensive range of value types as defined by a range of valuing frames, including ecosystem services, economic valuation and socio-cultural valuing approaches. A fundamental basis of our framework is that it is feature based – including both ecosystem and man-made features. The full range of socio-cultural, economic and ecological values can then be associated with that feature, and these can then be overlain in spatial systems to produce a comprehensive spatial valuation. In addition, the socio-cultural values associated with man-made features (such historical wrecks, buildings etc.) can be captured in the spatial values system.
-
This record contains catch and effort data from scientific bottom trawl surveys carried out along the coast of South East Australia between 1898 and 1996. The data is on demersal chondrichthyes and osteichthyes. Data used was from multiple research vessels form various agencies and historical archives, The vessels included Soela, Courageous, Kapala, Zeehan, Challenger, Mary Belle, Bluefin, Petuna Endeavour, Margaret Philippa, Dannevig and Endeavour. Please refer to documentation link for further information.
-
Annual Report of the Protected Zone Joint Authority (PZJA) 1998-1999. This, the thirteenth Annual Report of the Protected Zone Joint Authority (PZJA), describes PZJA activities during the year ended 30 June 1999 and the condition of the fisheries in the Torres Strait Protected Zone (TSPZ). The PZJA is responsible for management of commercial and traditional fishing in the Australian area of the TSPZ and designated adjacent Torres Strait waters. See the cited report: AFMA (2000) Torres Strait Protected Zone Joint Authority - Annual Report 1998-1999. Australian Fisheries Management Authority, Canberra. 62pp.
-
The cited report describes the outcomes of a Pearl Industry Workshop which was held on 22-23 June 1994, at the Thursday Island College of TAFE. This workshop was part of a DPI Queensland Project funded by AFMA, and aimed to improve the efficiency of the Torres Strait and East Coast Pearl Fishery and benefit Torres Strait Communities by examining research and management options. The project and workshop objectives were to: * facilitate discussion between pearl farmers and government agencies 1994 Queensland Pearl Industry Workshop * collate and communicate research on pre-farm handling techniques and on farm management. * provide a forum for discussion of hatchery technology, fisheries management options, licensing arrangements, seeding and marketing. * establish the research needs of the industry. Refer to the cited report: Golden S, Turnbull C and Coles R. eds. (1994) Developing the Torres Strait and Queensland East Coast Pearl Industry. 1994 Industry Workshop. 22-23 June, Torres Strait. Conference and Workshop Series QC94006. Queensland Department of Primary Industries, Brisbane, Australia. 50pp.
-
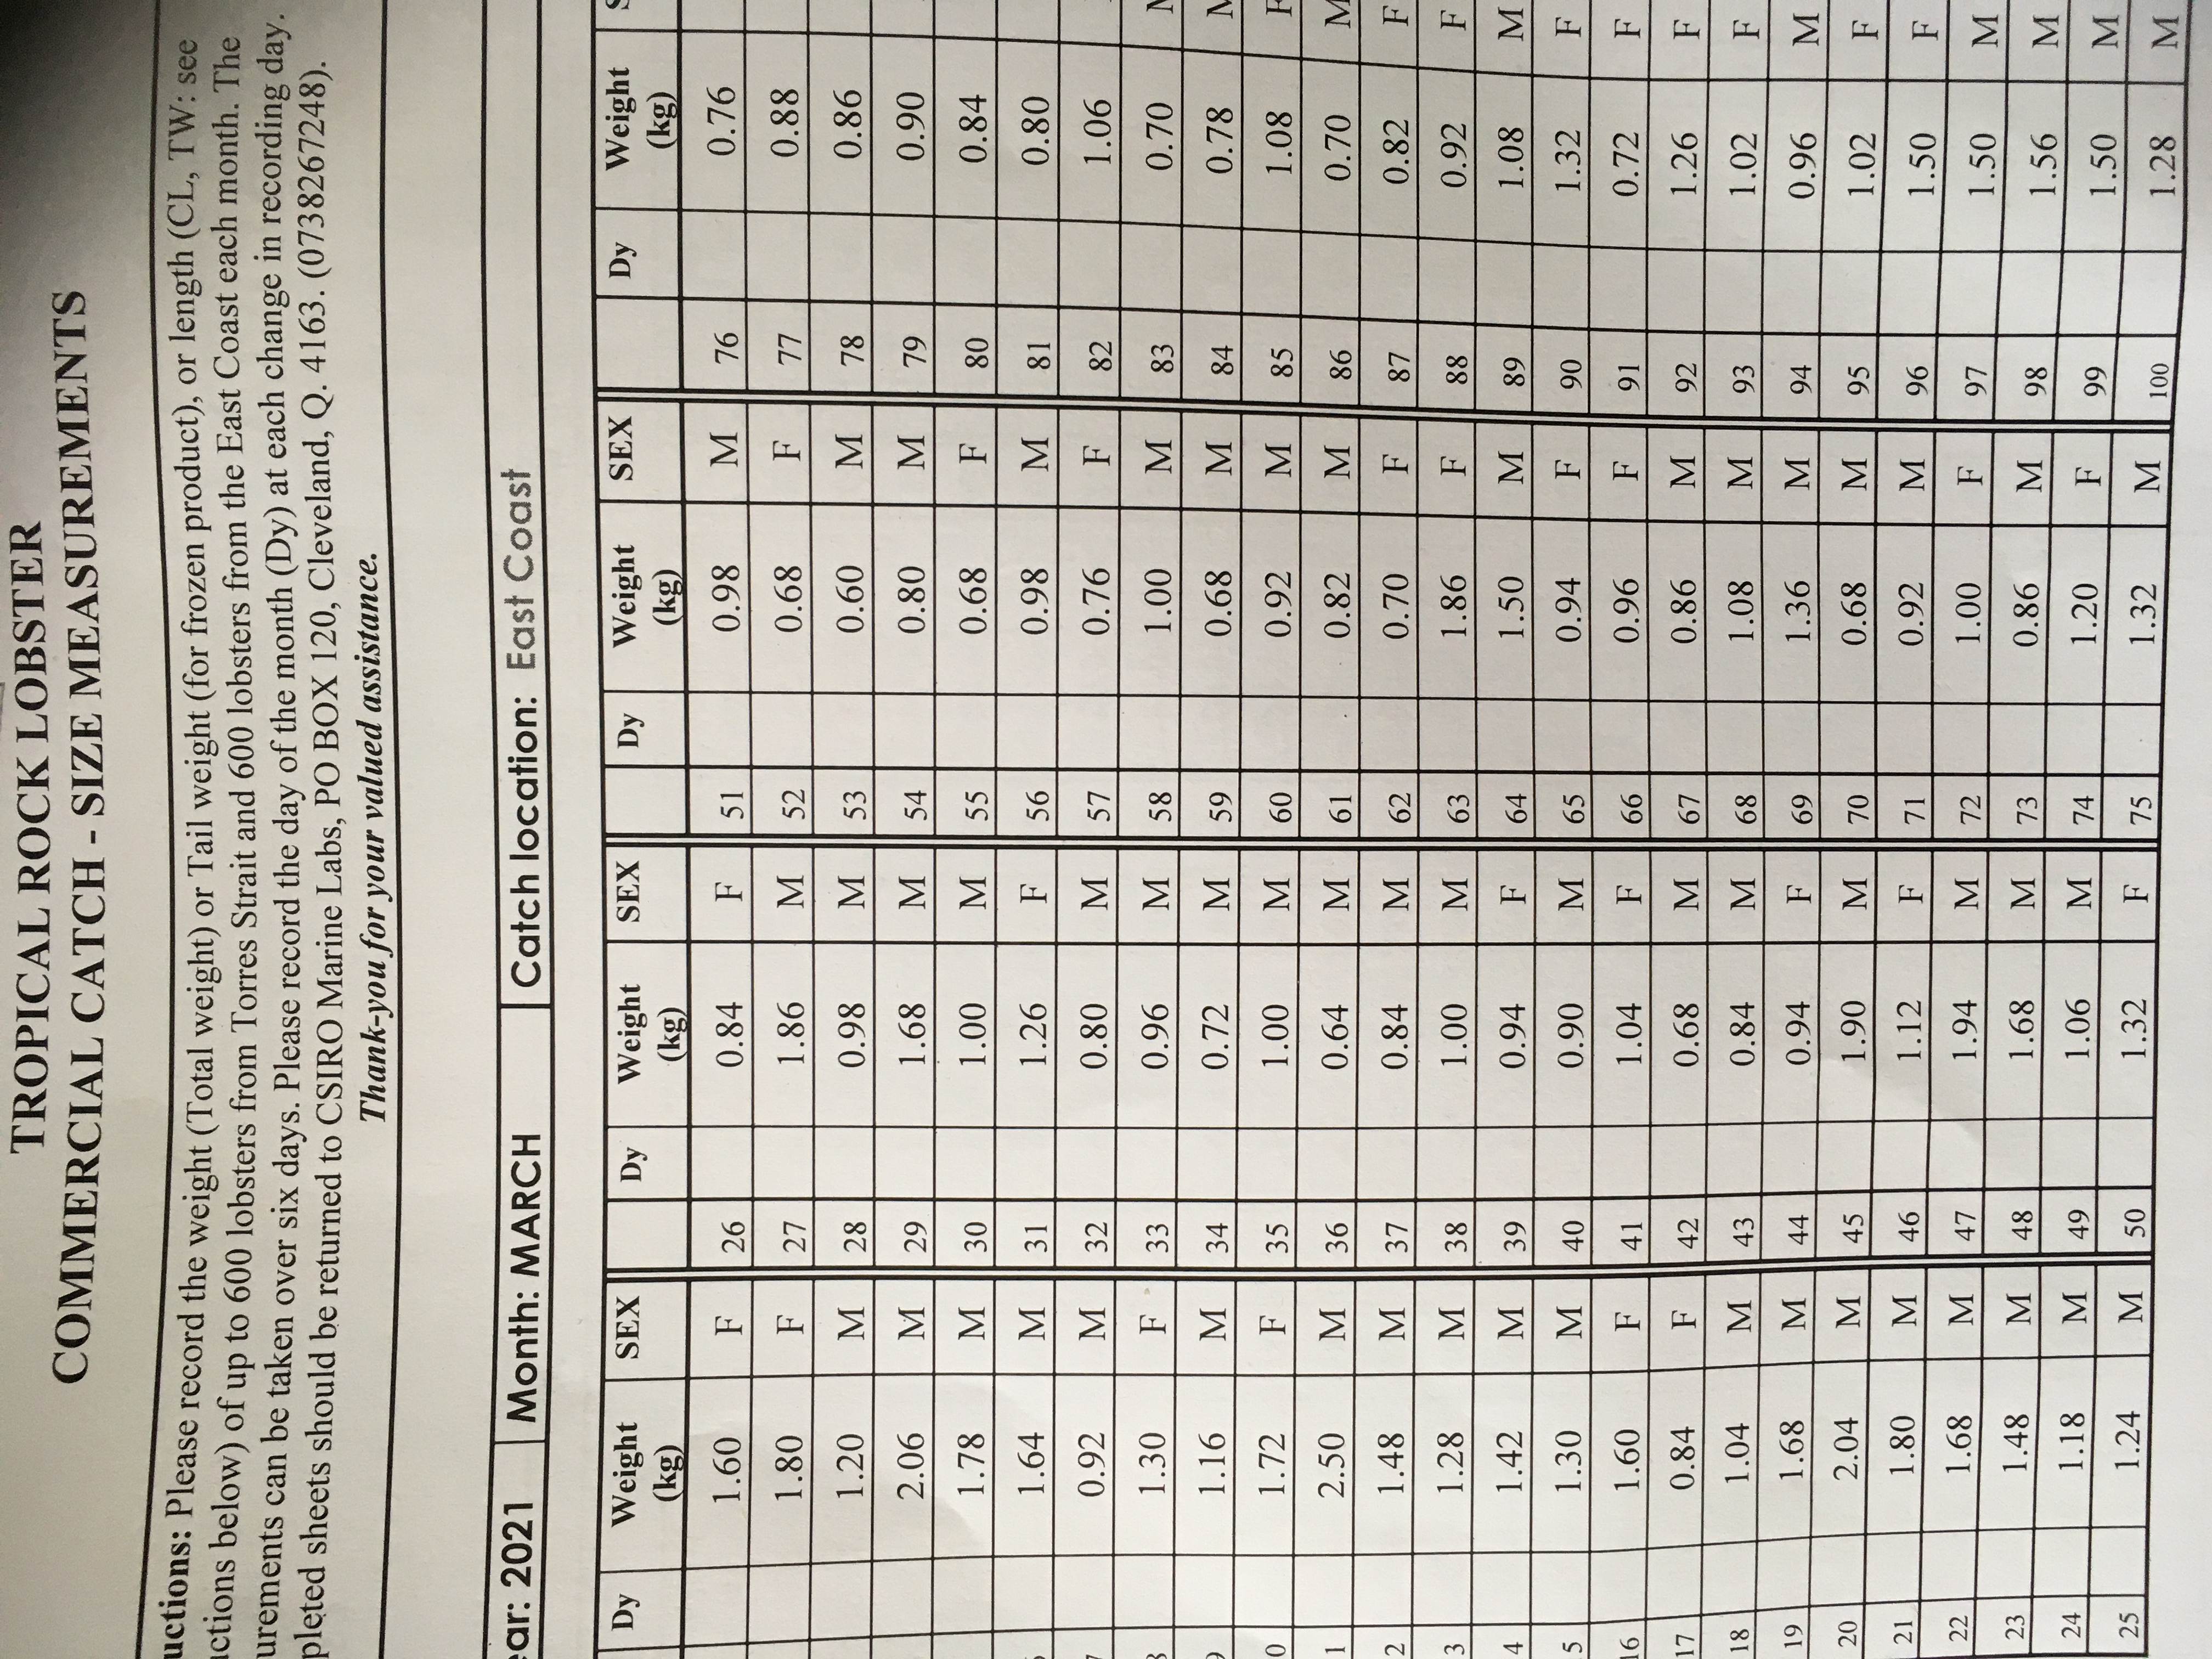
Total weights of Tropical Rock Lobsters (Panulirus ornatus) recorded by industry processing plant. Weights are recorded as total weight (kg) to the nearest 10g, and lobster sex and catch location ("East Coast", "Torres Strait", "PNG") are also recorded. Data are collected under a verbal agreement between CSIRO and Kailis (M. G. Kailis Pty Ltd), with Kailis supplying weights every month during the fishing season (approx Feb - Sep). Data are entered into the CSIRO database system.
-
Characterization of the traditional fisheries of the PNG Treaty villages (Torres Strait and Papua New Guinea) - AFMA Project RR2012/0813. The main objectives of the project were to: 1. Assess the status of marine resources exploited on the PNG side of the Torres strait area. 2. Understand the role marine resources have within the livelihood portfolios of coastal villages in the WP of PNG Understand how the socio-economic conditions of these communities drive exploitation patterns of marine resources. 3. Provide background information on the characteristics of PNG Treaty villages for the CSIRO/NERP project to design livelihoods typology and contribute information/data to the scenario planning workshops and FGDs in vulnerable communities. The Western Province, Papua New Guinea (PNG), has some of the most important and diverse marine ecosystems, with mangroves, seagrasses, and coral reefs of global significance as part of the Coral Triangle. Goods and services from these ecosystems provide coastal communities in the Province for subsistence, cash income and cultural identity. As a border region (with Indonesia to the West and Australia to the South), marine resources have been traditionally traded and shared with neighboring countries. The dynamics of exploitation of marine resources are thus complicated by sharing and trading agreements with bordering countries, increasing the complexity of monitoring and managing these diverse marine ecosystems and their resources. Human impacts have likely degraded these ecosystems in the last few decades. Population growth and internal migration to the area are increasing the exploitation of local marine ecosystems. Mining and other future resource extraction and infrastructure projects in the Province will likely increase adverse pressures on marine resources. Climate change will also present coastal communities in the region with challenges in the next future. Even considering the importance of these resources and the above mentioned threats, there is a lack of information on the overall status of the traditional artisanal and subsistence fisheries for species such as coastal, estuarine and reef finfish, tropical rock lobster, beche-de-mer and trochus (AFMA 2005). A recent survey in the PNG treaty villages found that one of the main issues within the communities was overexploitation of marine resources and the need for sustainable fishing practices (Roe 2010). To address this concern, and provide baseline information for future co-management arrangements at a cross-jurisdictional level, baseline information on the socio-economic and ecological characteristics of the traditional fisheries is required. The overall aim of the project is to assess the status of exploited marine resources in this border region and understand the role marine resources have for the livelihoods and food security of coastal communities in the Western Province of PNG and how socio-economic conditions of these communities drive exploitation patterns of marine resources. The final outcome from this research will provide a clear understanding of the overall multi-sectoral cross-jurisdictional exploitation of marine resources in the Treaty area. Contribution from this project can have a positive multi-scale impact on the sustainable use of shared stocks. Understanding both the socioeconomic and ecological context of marine resources exploitation is paramount to support sound management decisions and the success of any future management and development initiatives. Management agencies and communities in the Treaty area will benefit from information currently lacking to support their management decisions. Collected information has the potential to be used in future as a framework for co-management arrangements at a cross-jurisdictional level. This information will also help management and aid agencies to better allocate resources in future development projects.
-
This dataset contains summaries of QLD Department of Agriculture and Fisheries (DAF) logbook data on effort distribution for QLD commercial fisheries in state marine and estuarine waters. The logbook data has been recorded and submitted to QLD DAF by commercial fishers. https://www.business.qld.gov.au/industries/farms-fishing-forestry/fisheries/monitoring-reporting/requirements/logbooks The data are aggregated to produce summaries of total effort by fishing activity or method (summarised across fishery), over 5 year periods and at a 0.1 degree resolution where 5 boats or more operate. All effort information has been removed for areas where less than 5 boats operate and these areas are mapped to a 1 degree resolution with effort indicated as presence-only. The 5 year periods (2006-2010, 2011-2015) correspond to State of Environment (SoE) Reporting, required under the EPBC Act 1999. Each map layer is labelled by the years aggregated (“2015” for 2011-2015) and the fishing activity (e.g. “Harvest”). The gear codes and aggregated fisheries and the shape file field descriptions are listed separately in the Supplemental Information section. The data were supplied for the purpose of research being undertaken by CSIRO under the National Environmental Science Programme (NESP) Marine Biodiversity Hub to produce an interactive map of pressures on the marine environment (at a broad spatial scale) that will enable a systematic understanding of the different pressures acting in different areas. Disclaimer The Department of Agriculture and Fisheries (DAF), Queensland, makes no representations about the content and suitability of the map and summary data presented for any purpose. Specifically, DAF does not warrant, guarantee or make any representations regarding the correctness, accuracy, reliability, currency, or any other aspect regarding characteristics or use of the information presented in the maps and summary data. The user accepts sole responsibility and risk associated with the use and results of the maps and summary data, irrespective of the purpose to which such use or results are applied. In no event shall DAF be liable for any special, indirect or consequential damages or any damages whatsoever resulting from loss of use, data or profits, whether in an action of contract, negligence or tort, rising out of or in connection with the use of the maps and summary data.