Keyword
Earth Science | Oceans | Ocean Circulation | Wind-Driven Circulation
17 record(s)
Type of resources
Topics
Keywords
Contact for the resource
Provided by
Formats
Update frequencies
Status
draft
-

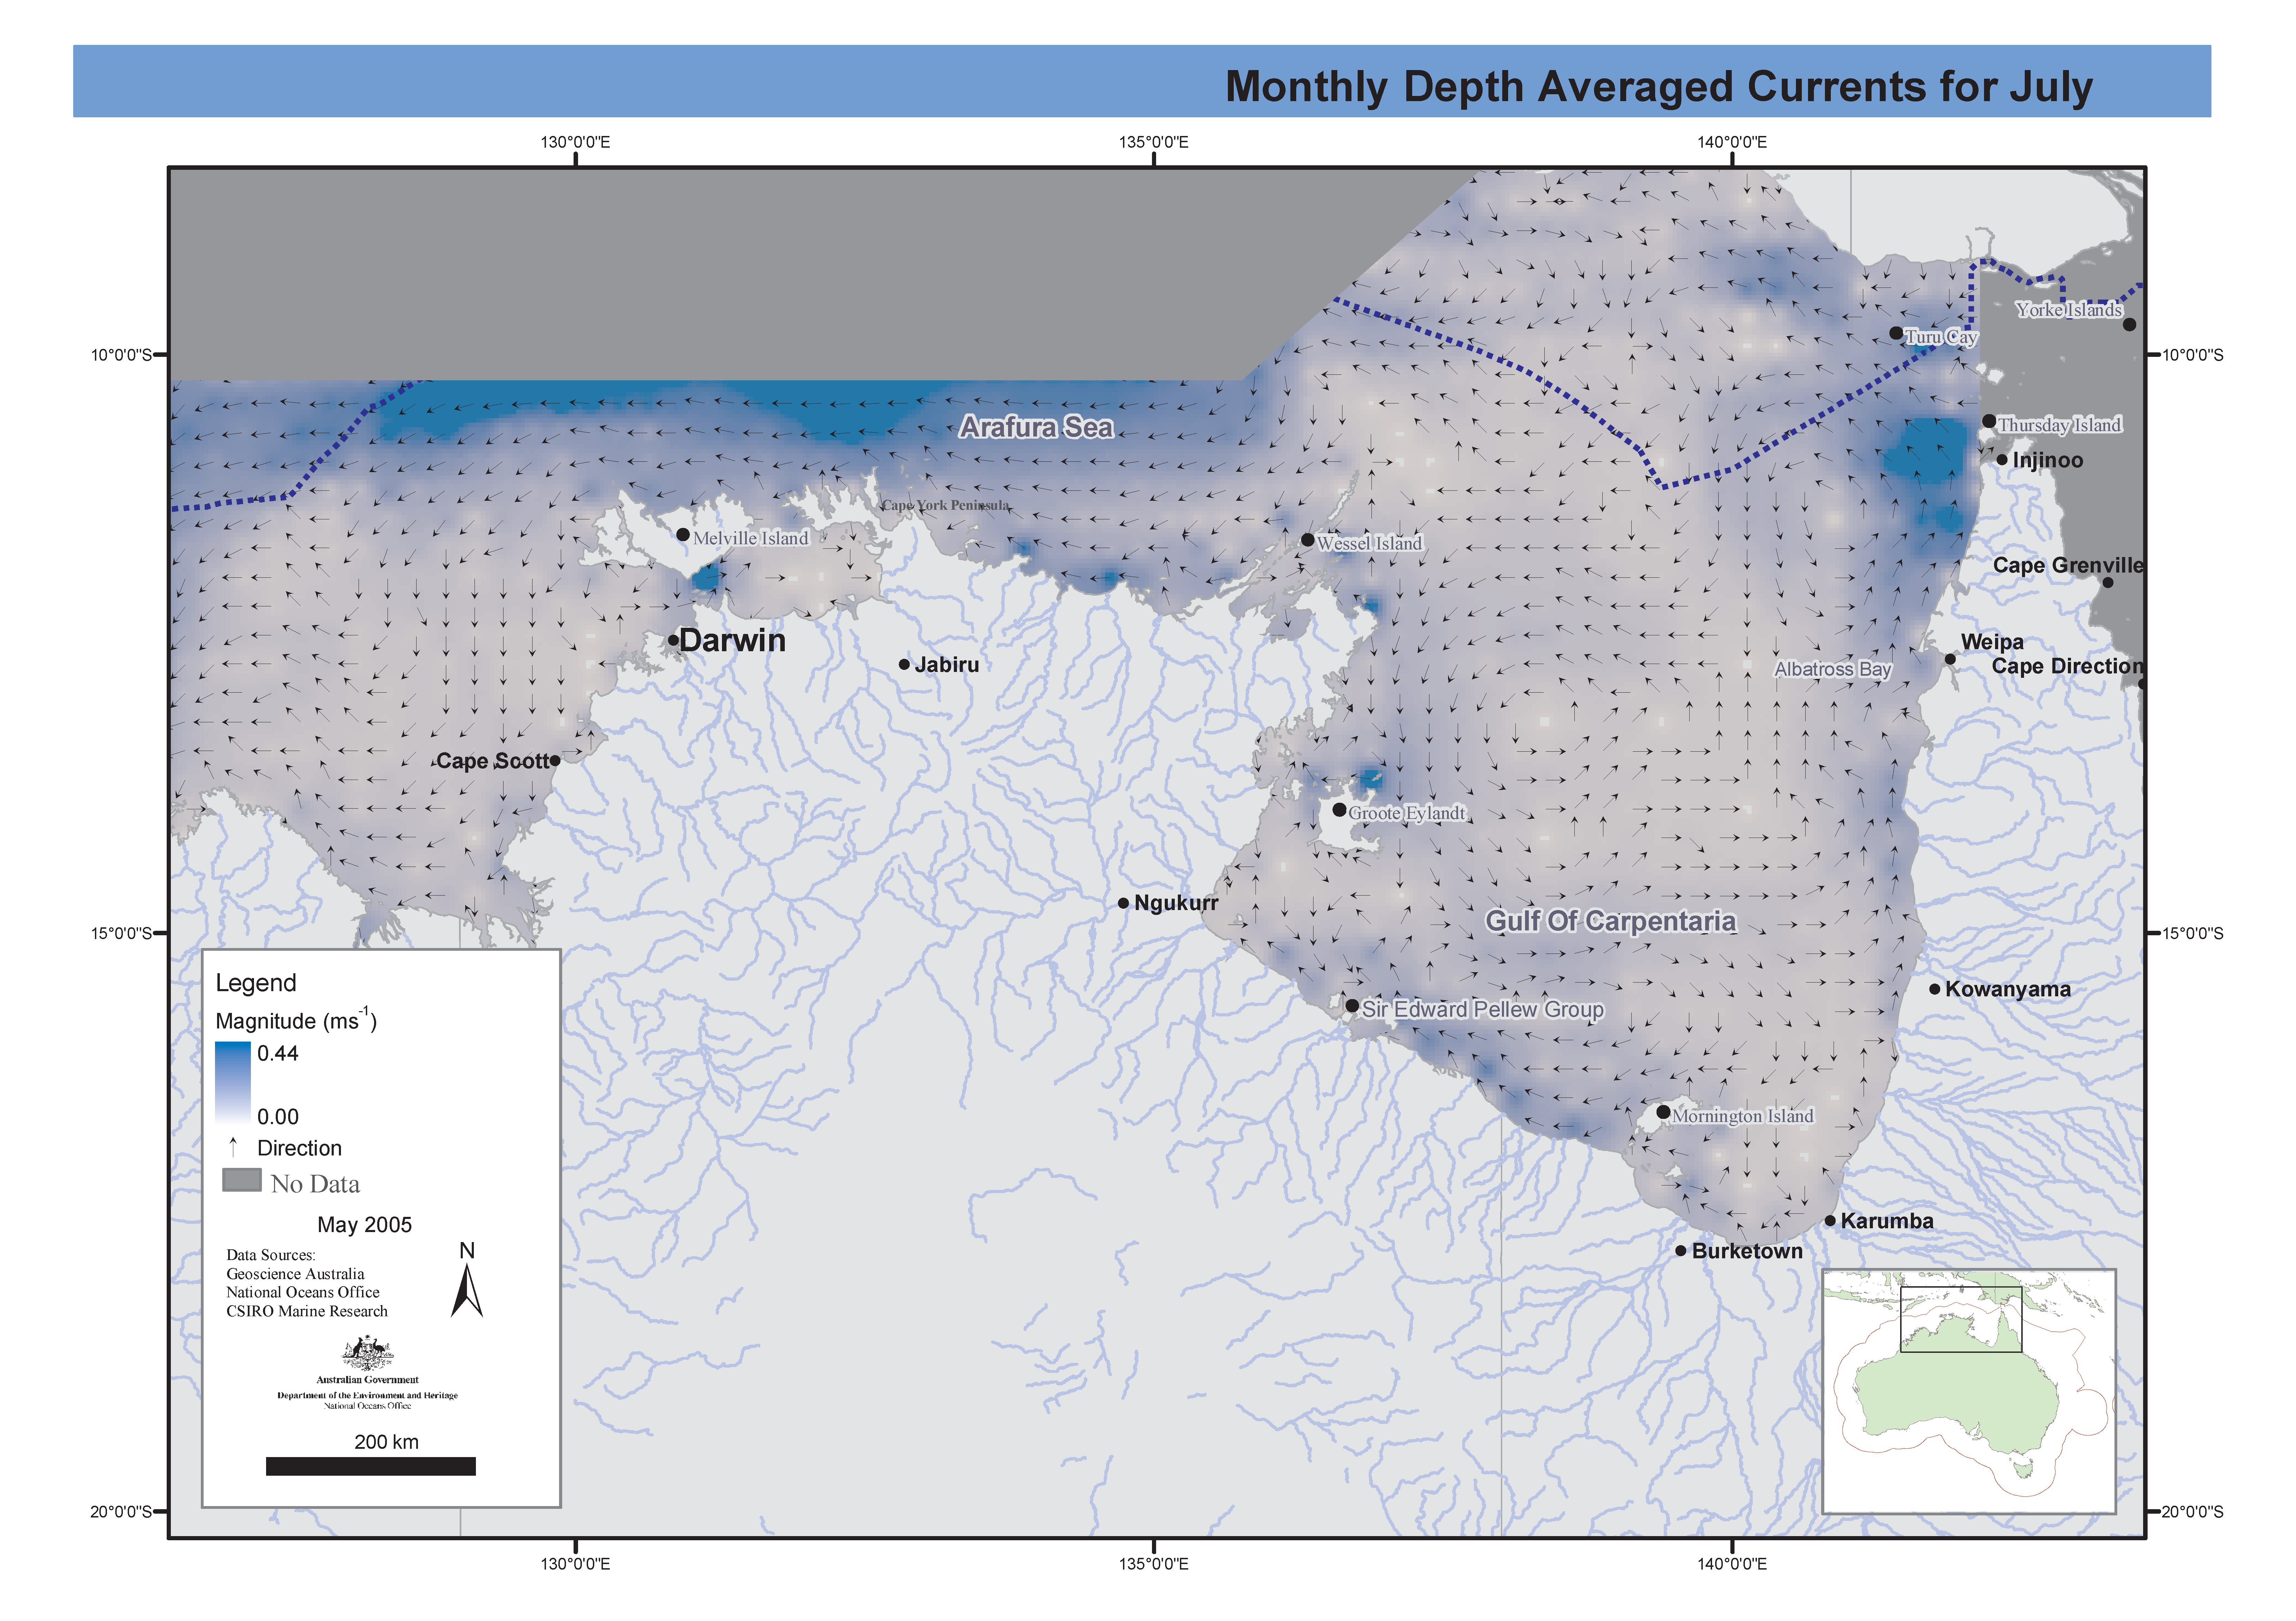
Set of maps showing currents in the Northern Marine Region for the wet (January) and dry (July) seasons. These maps have been produced by CSIRO for the National Oceans Office, as part of an ongoing commitment to natural resource planning and management through the 'National Marine Bioregionalisation' project.
-
Set of maps by month, showing feature classes determined by satellite sea surface temperature. Classes show core water masses, mixed water masses, frontal water masses and high gradient fronts. These maps have been produced by CSIRO for the National Oceans Office, as part of an ongoing commitment to natural resource planning and management through the 'National Marine Bioregionalisation' project.
-
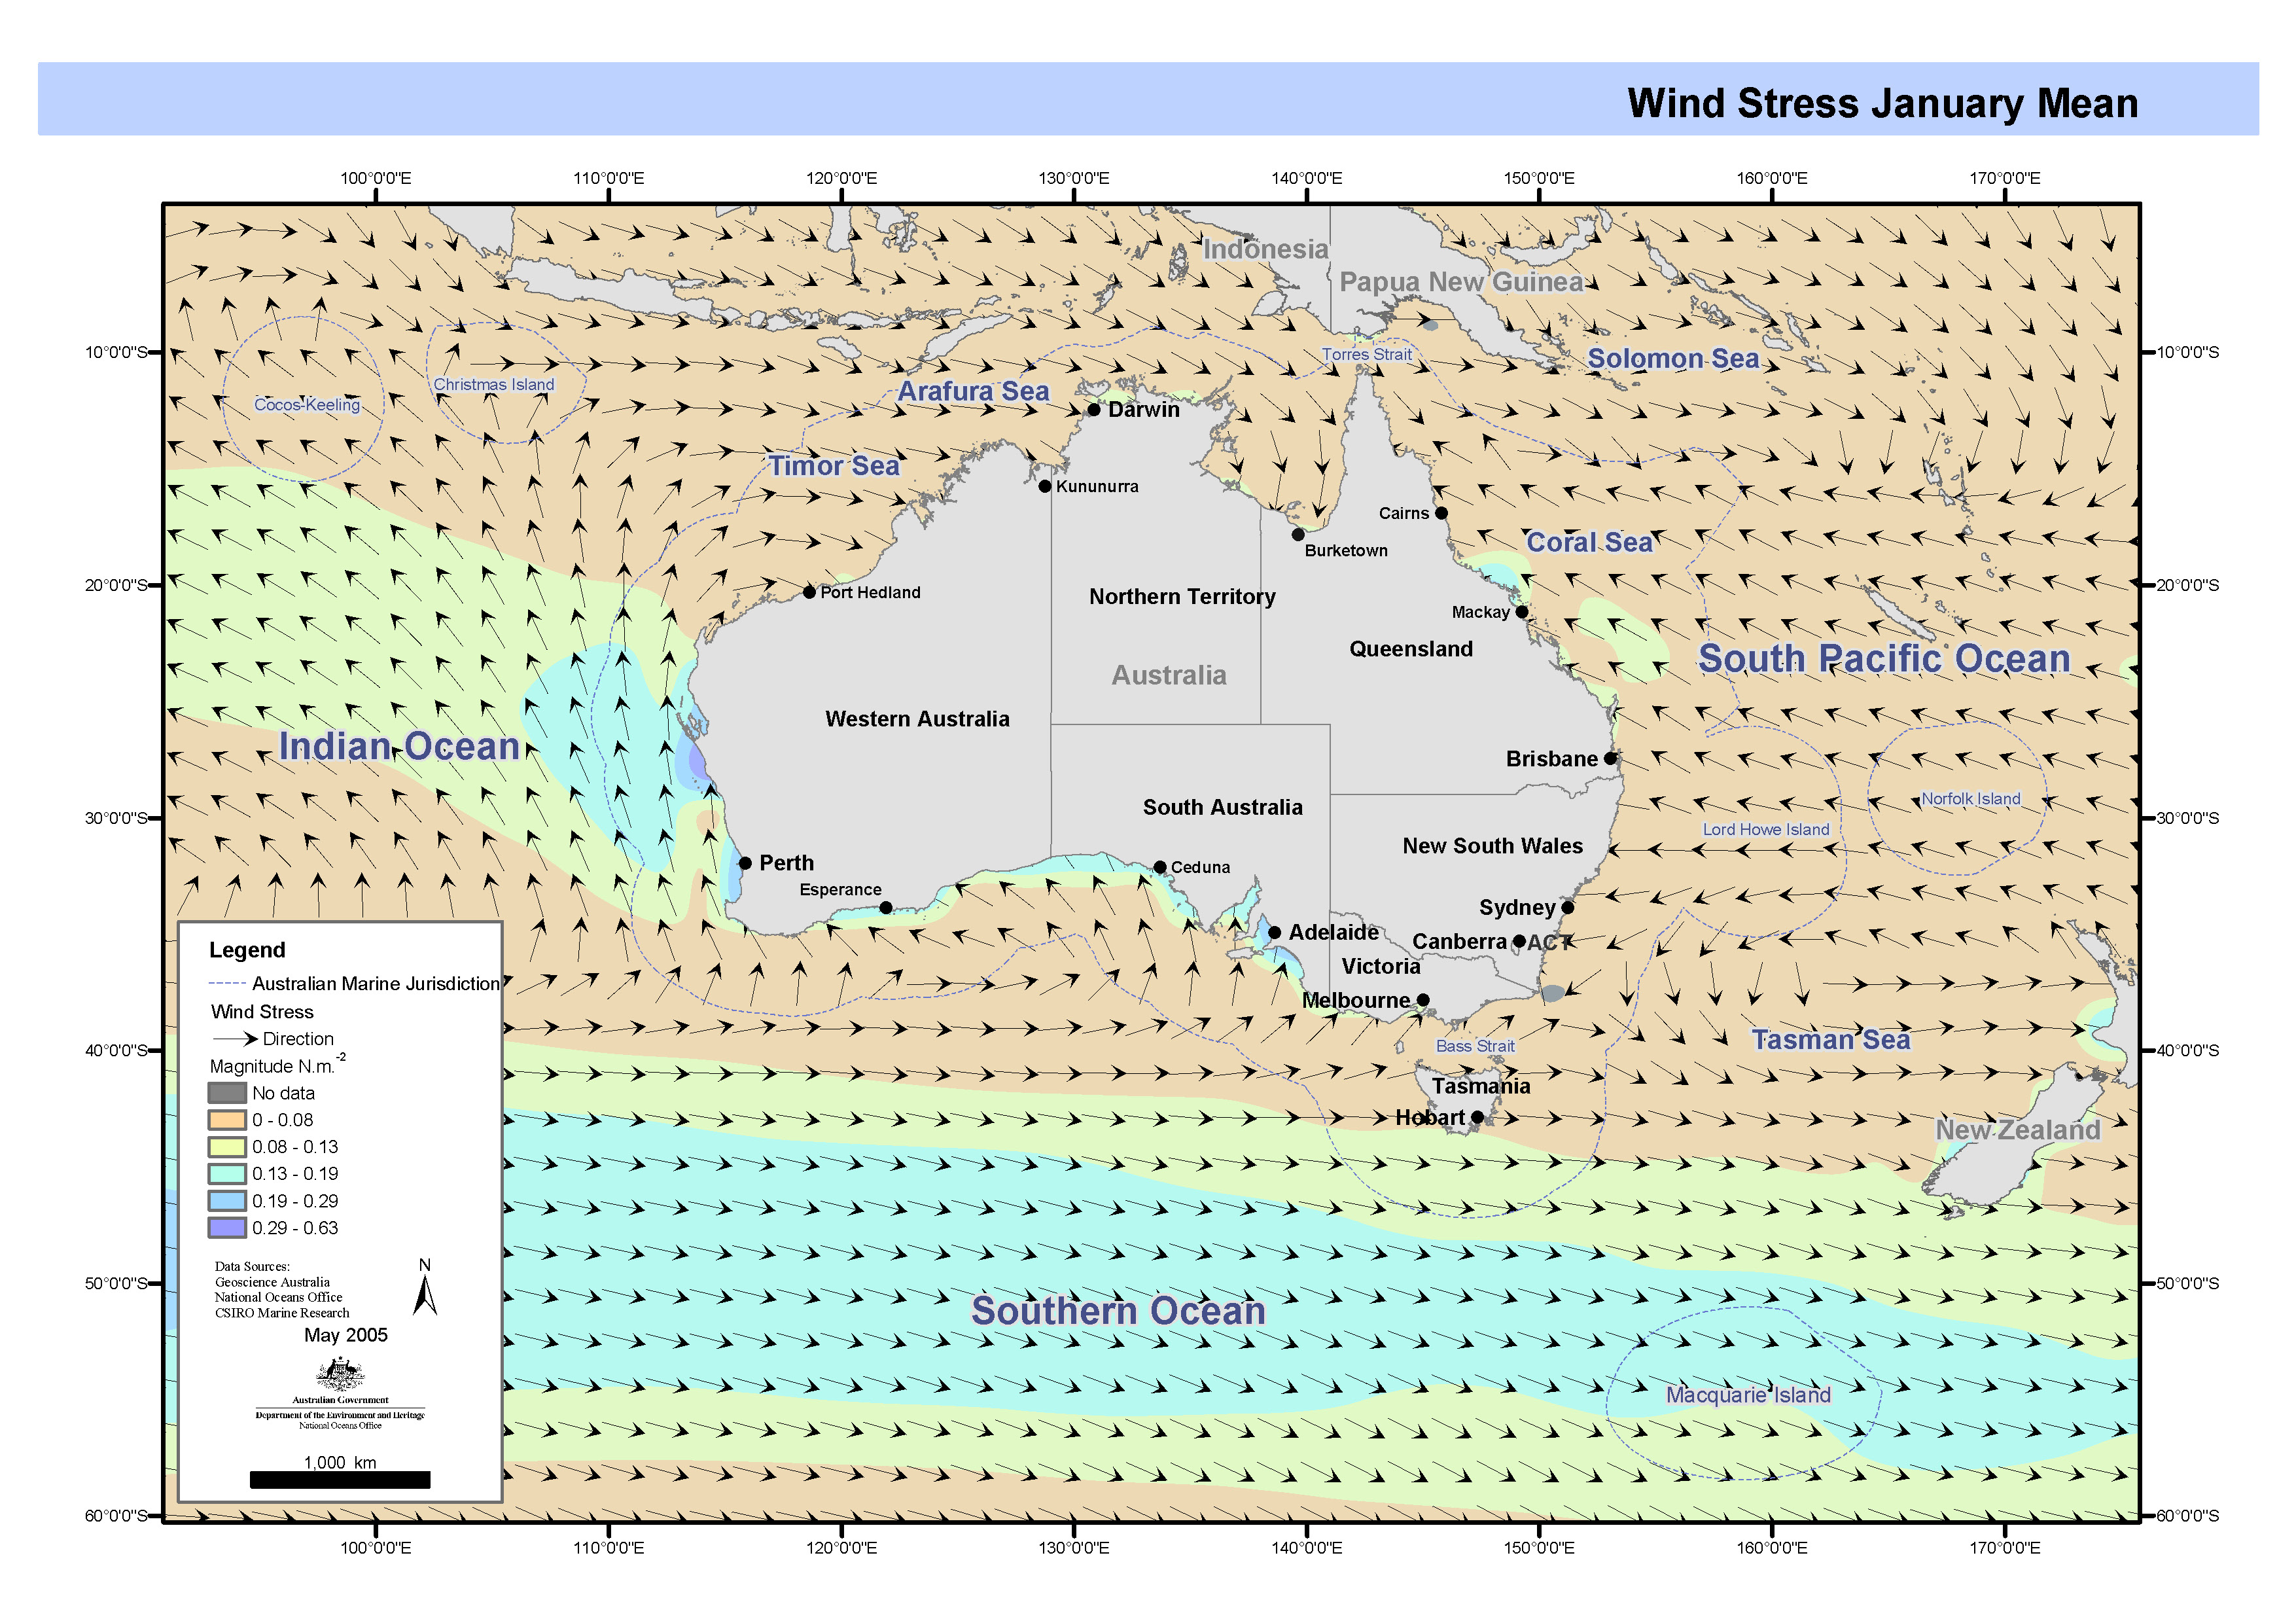
Wind-induced currents are among the strongest currents in the oceanic surface layer. Winds drive ocean currents by transferring momentum to this layer. The important quantity in this process is the wind stress, which is a quadratic function of wind speed. The data used in this project were produced by the NCEP/NCAR reanalysis project. NCEP and NCAR are cooperating in a project to produce a 40-year record of global analyses of atmospheric fields in support of the needs of the research and climate monitoring communities. The wind-stress dataset covers the period 1965 to 1997 and contains the following fields from which the velocity vector (speed and direction) were calculated: .zonal wind stress .meridional wind stress
-
Maps showing quarterly means of wind curl on Australia's oceans from interpreted basedata supplied by the National Centers for Environmental Prediction (NCEP) Re-analysis Project, 1976 to 1998 inclusive. These maps have been produced by CSIRO for the National Oceans Office, as part of an ongoing commitment to natural resource planning and management through the 'National Marine Bioregionalisation' project.
-

Maps showing quarterly means of wind stress on Australia's oceans from data supplied by the National Centers for Environmental Prediction (NCEP) Re-analysis Project, 1976 to 1998 inclusive. This map has been produced by CSIRO for the National Oceans Office, as part of an ongoing commitment to natural resource planning and management through the 'National Marine Bioregionalisation' project.
-
Six hourly model outputs of wind (u and v) for 1999 and 2003.
-
The Connectivity Interface or "ConnIe" has been developed as a tool for environmental scientists and managers to investigate the patterns of spatial connectivity on Australia's North West Shelf (NWS). Specifically, it provides the user with an estimate of the probability that any two regions are connected by modelled ocean circulation over a specified dispersion period. These connectivity statistics were computed from the paths of neutrally buoyant particles computed from the "Northwest" circulation model (based on MECO), run over the period from 1994 to 1999. The circulation model used a rotated latitude-longitude grid, with a horizontal resolution of approximately 10km and a vertical resolution expanding from 3 m near the surface to a maximum of 200 m at depths below 1000 m. The model was forced by wind fields from the NCEP-NCAR Reanalysis, while temperature and salinity fields around the lateral boundaries were interpolated from a global circulation model known as the Australian Community Ocean Model (ACOM). Sea levels on the boundaries were also taken from the global model output, with the addition of a tidal component derived from a combination of coastal sea level data and output from a global tidal model. ConnIe is expected to find applications in areas such as larval dispersion and recruitment studies, and the development of scenarios and risk assessments for contaminant dispersion.
-
The eddy-resolving Ocean Forecasting Australia Model (OFAM) is used to downscale future climate projections by CSIRO Mk3.5 climate model under scenario A1B for the 2060s. A simulation run without relaxation and another run with relaxation to expected sea surface temperature and sea surface salinity are archived with 3D fields of ocean temperature, salinity, currents, and sea surface height.
-
The eddy-resolving Ocean Forecasting Australia Model (OFAM) is used to downscale future climate projections by CSIRO Mk3.5 climate model under scenario A1B for the 2060s.
-
The dataset comprises output from a circulation model of the NWS based on the three-dimensional non-linear hydrodynamic model referred to as MECO. The model spans the Pilbara coast (Ningaloo to Port Hedland) with a horizontal resolution of approximately 5km and vertical resolution expanding from 3 m near the surface to a maximum of 200m at depths below 1000m. Outputs cover the period from August 1996 to May 1998 with hourly outputs of sealevel, surface temperature, surface salinity, surface currents, depth-averaged currents, and bottom friction velocity, as well as 5 day outputs of the full 3-dimensional fields of temperature, salinity, and velocity.
