Keyword
Earth Science | Biosphere | Ecological Dynamics | Ecosystem Functions | Primary Production
40 record(s)
Type of resources
Topics
Keywords
Contact for the resource
Provided by
Formats
Update frequencies
Status
draft
-
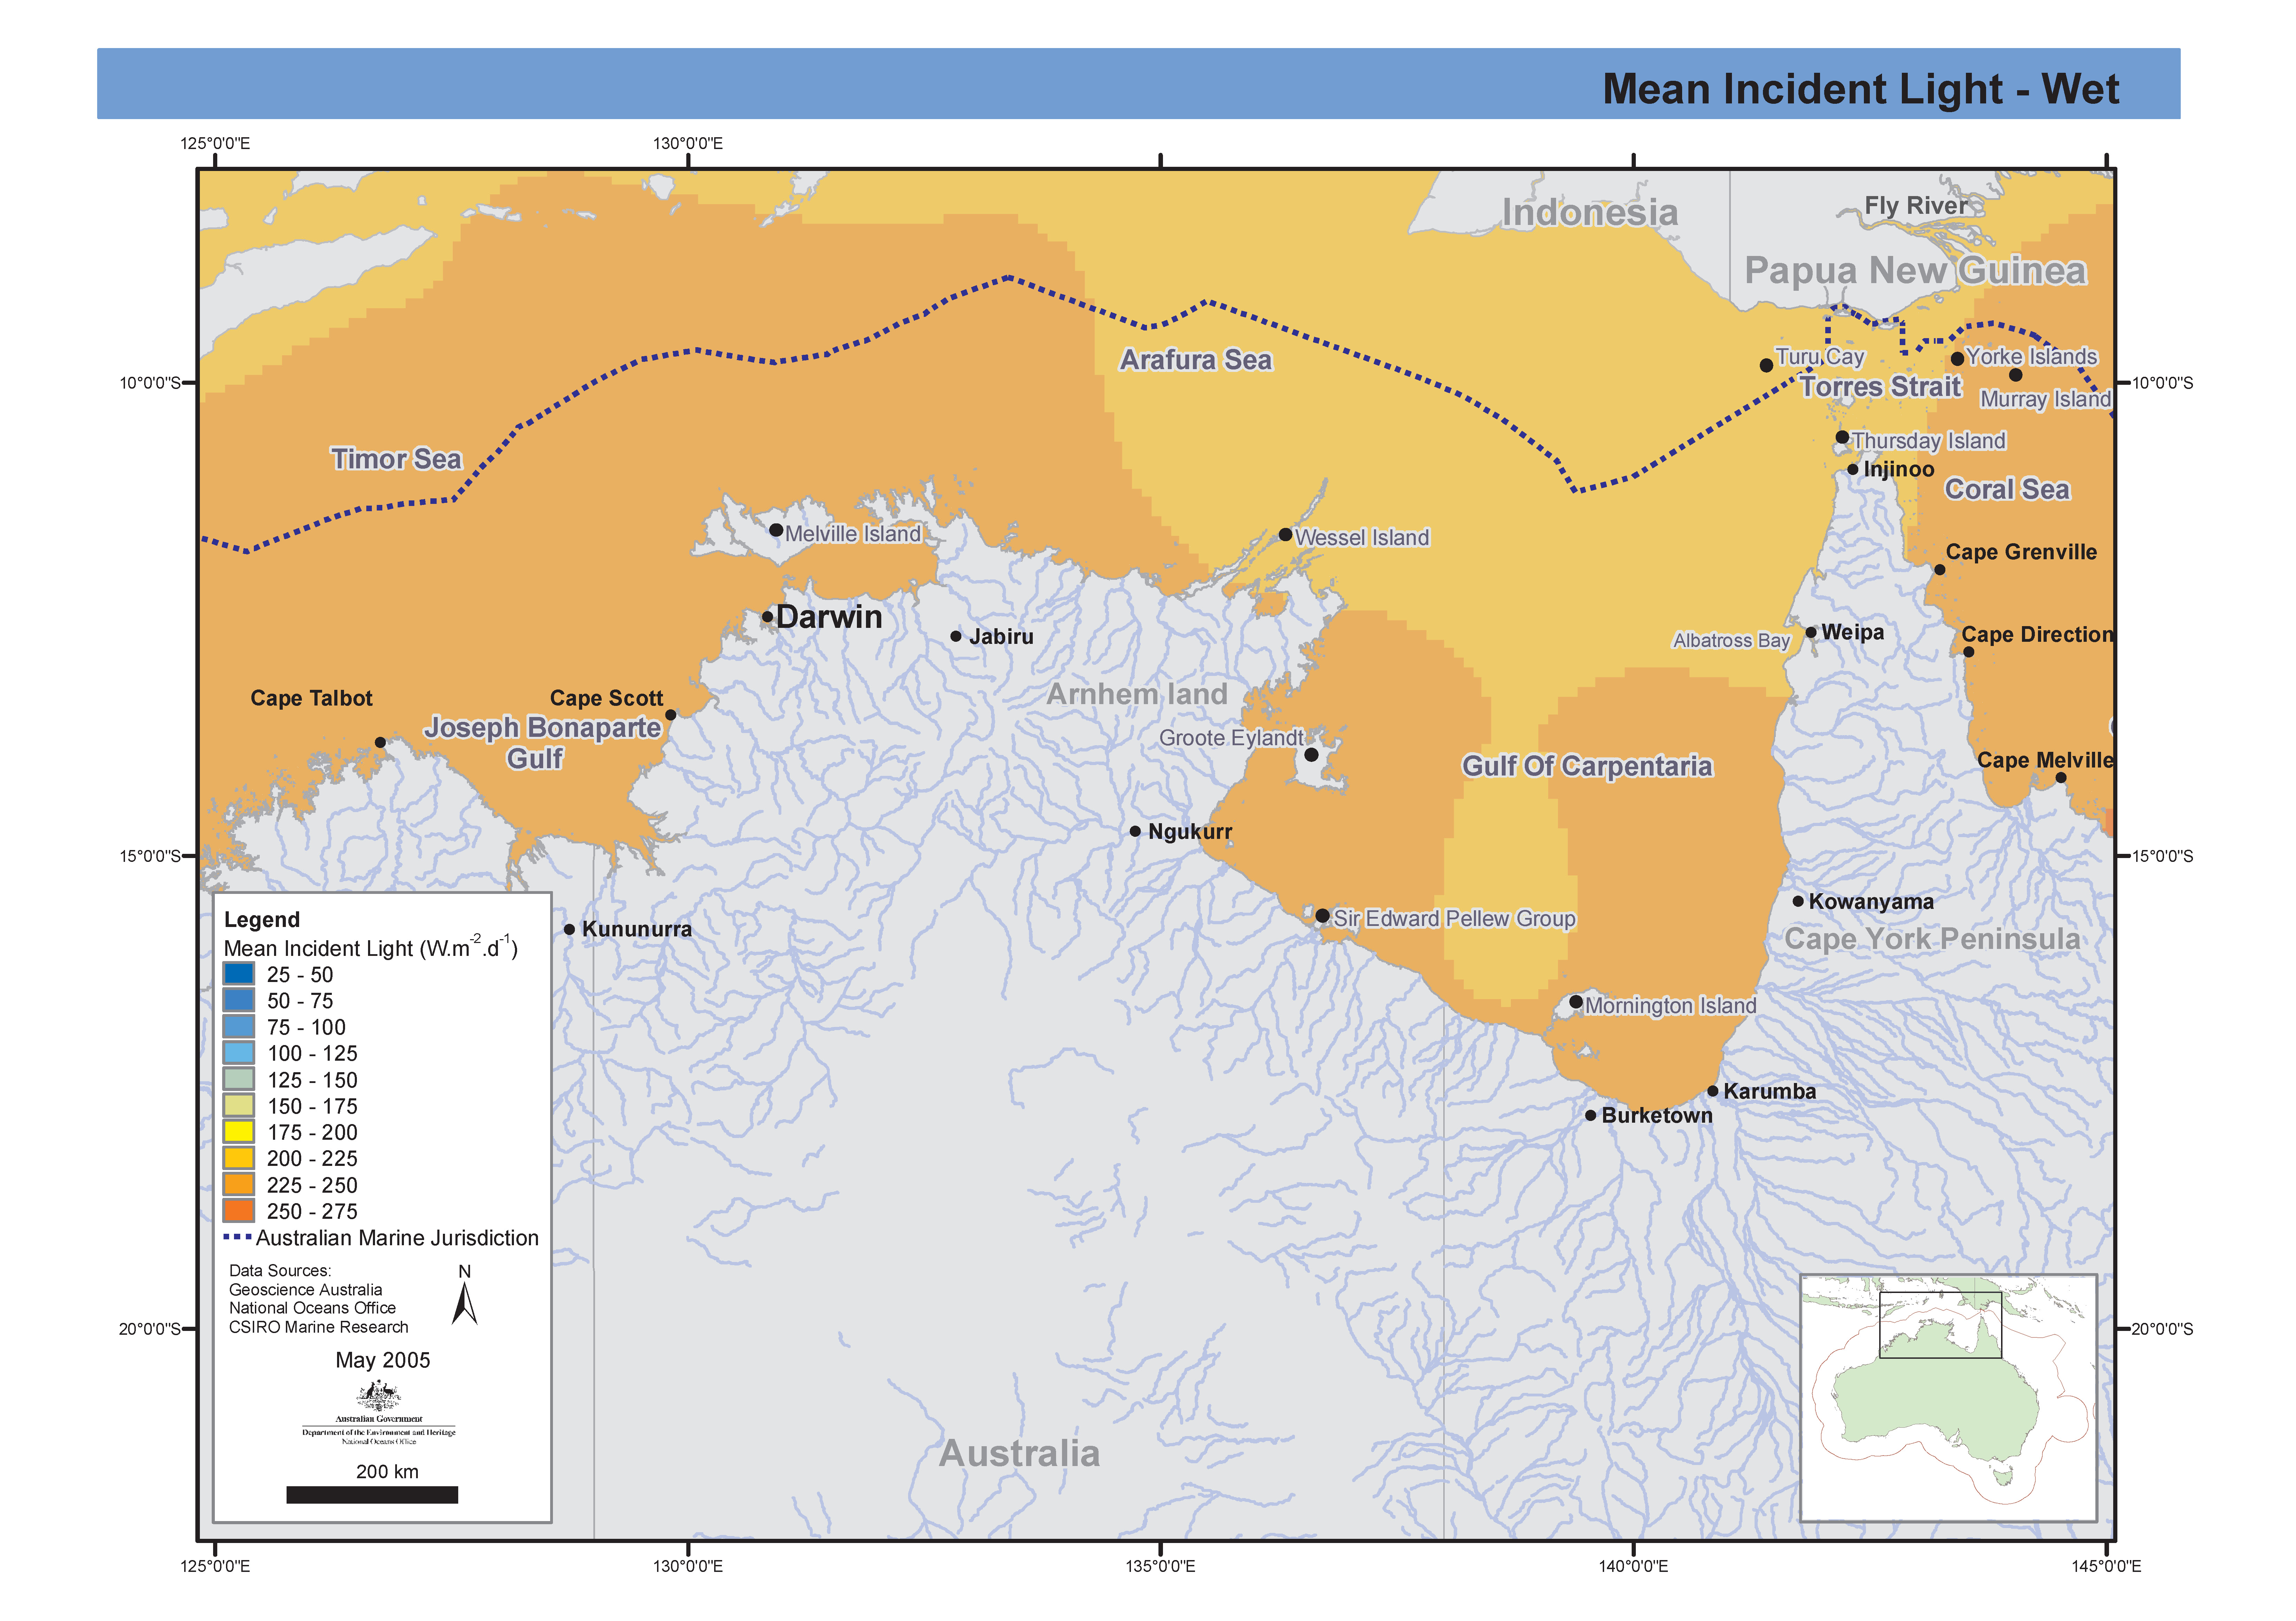
Maps showing the mean incident light for the both the wet season and dry season in the Northern Marine Region. This data is the surface solar irradiance data obtained for NASA/GISS to allow the production of photosynthetically active solar irradiance fields to allow the calculation of primary production using satellite ocean colour products. The information comes from the Internation Satellite Cloud Climatology Project (ISCCP) using C1 data from multiple geostationary and polar orbiting meteorological satellites to provide a global view of the occurrence and properties of clouds. Atmospheric, cloud and surface data from ICSSP are used as input along with a scheme for computing clear-sky irradiance from the solar zenith angle, air properties, and surface reflectance. The scheme then uses simple cloud properties (cloud fraction, cloud optical thickness, and diffuse albedo) to produce total and photosynthetically active solar irradiance fields (Bishop and Rossow 1991; ISCCP Documentation of Cloud Data; Frouin et al. 1989). Input and output data fields are given in a 2.5° latitude and longitude grid. These maps have been produced by CSIRO for the National Oceans Office, as part of an ongoing commitment to natural resource planning and management through the 'National Marine Bioregionalisation' project.
-
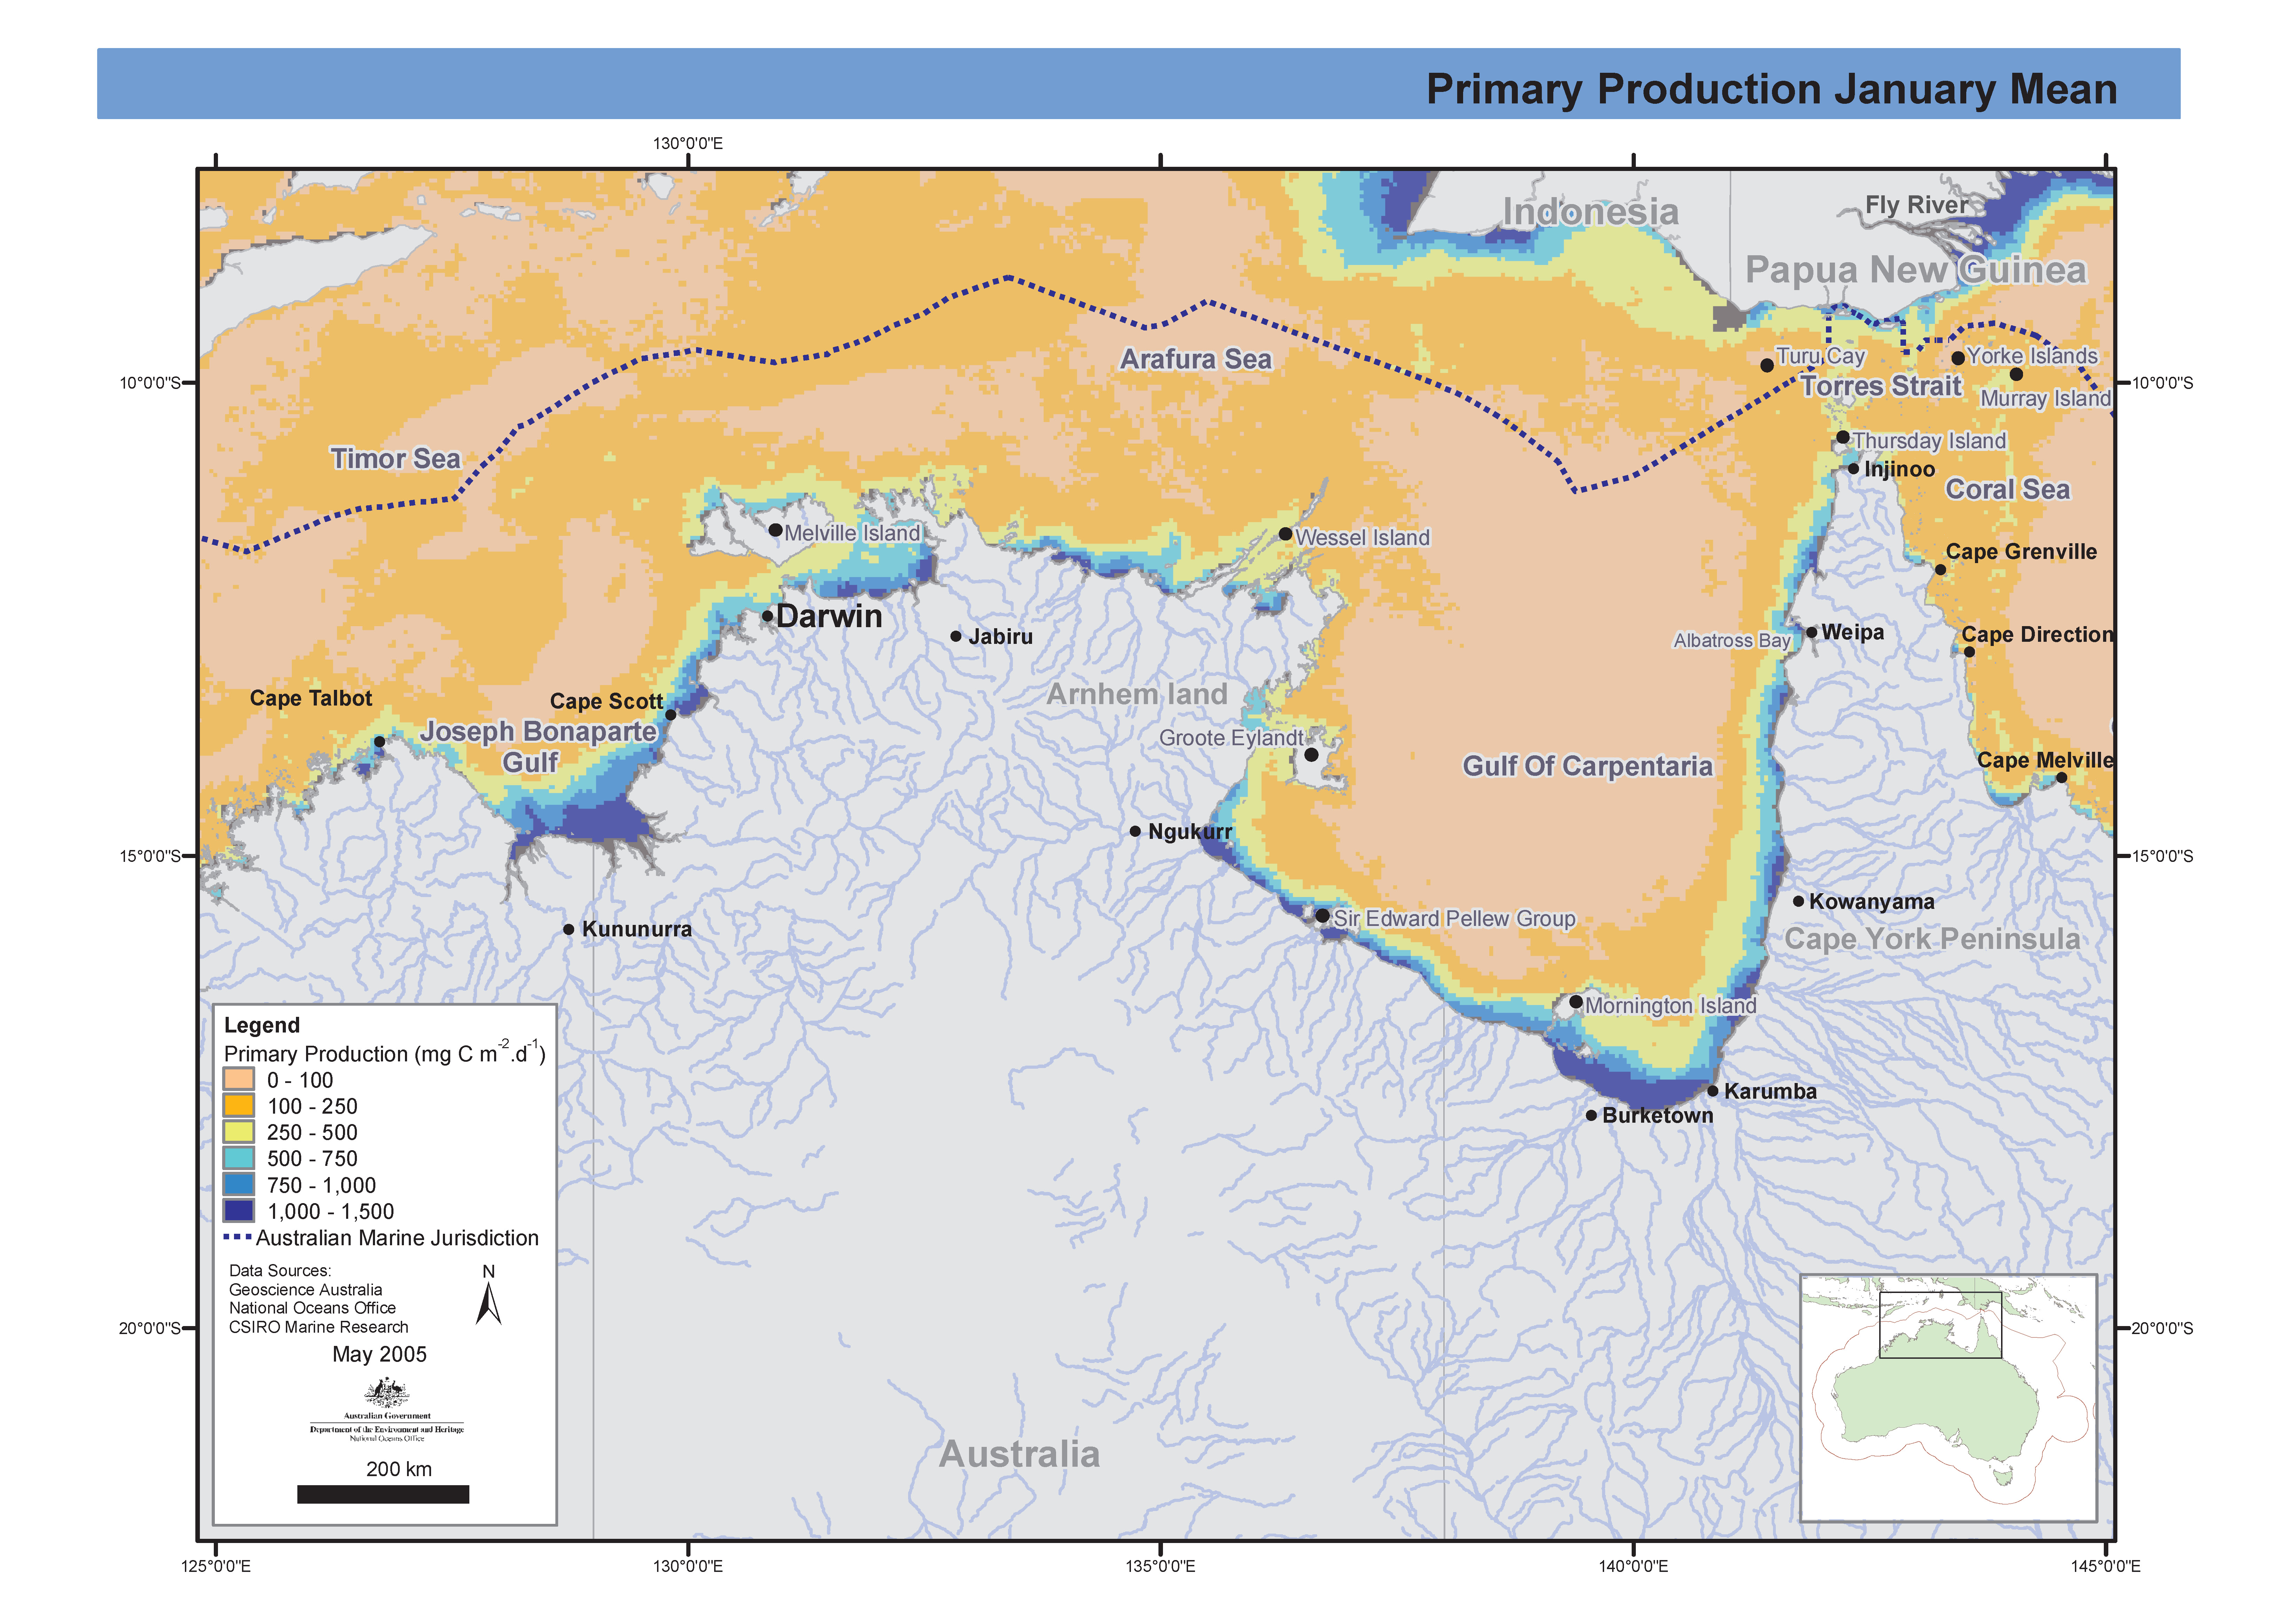
Set of two maps showing mean seasonal (wet/dry) ocean primary production in the Northern Marine Region extracted from global observations of ocean colour data from the moderate resolution imaging spectroradiometer (MODIS). These maps have been produced by CSIRO for the National Oceans Office, as part of an ongoing commitment to natural resource planning and management through the 'National Marine Bioregionalisation' project.
-
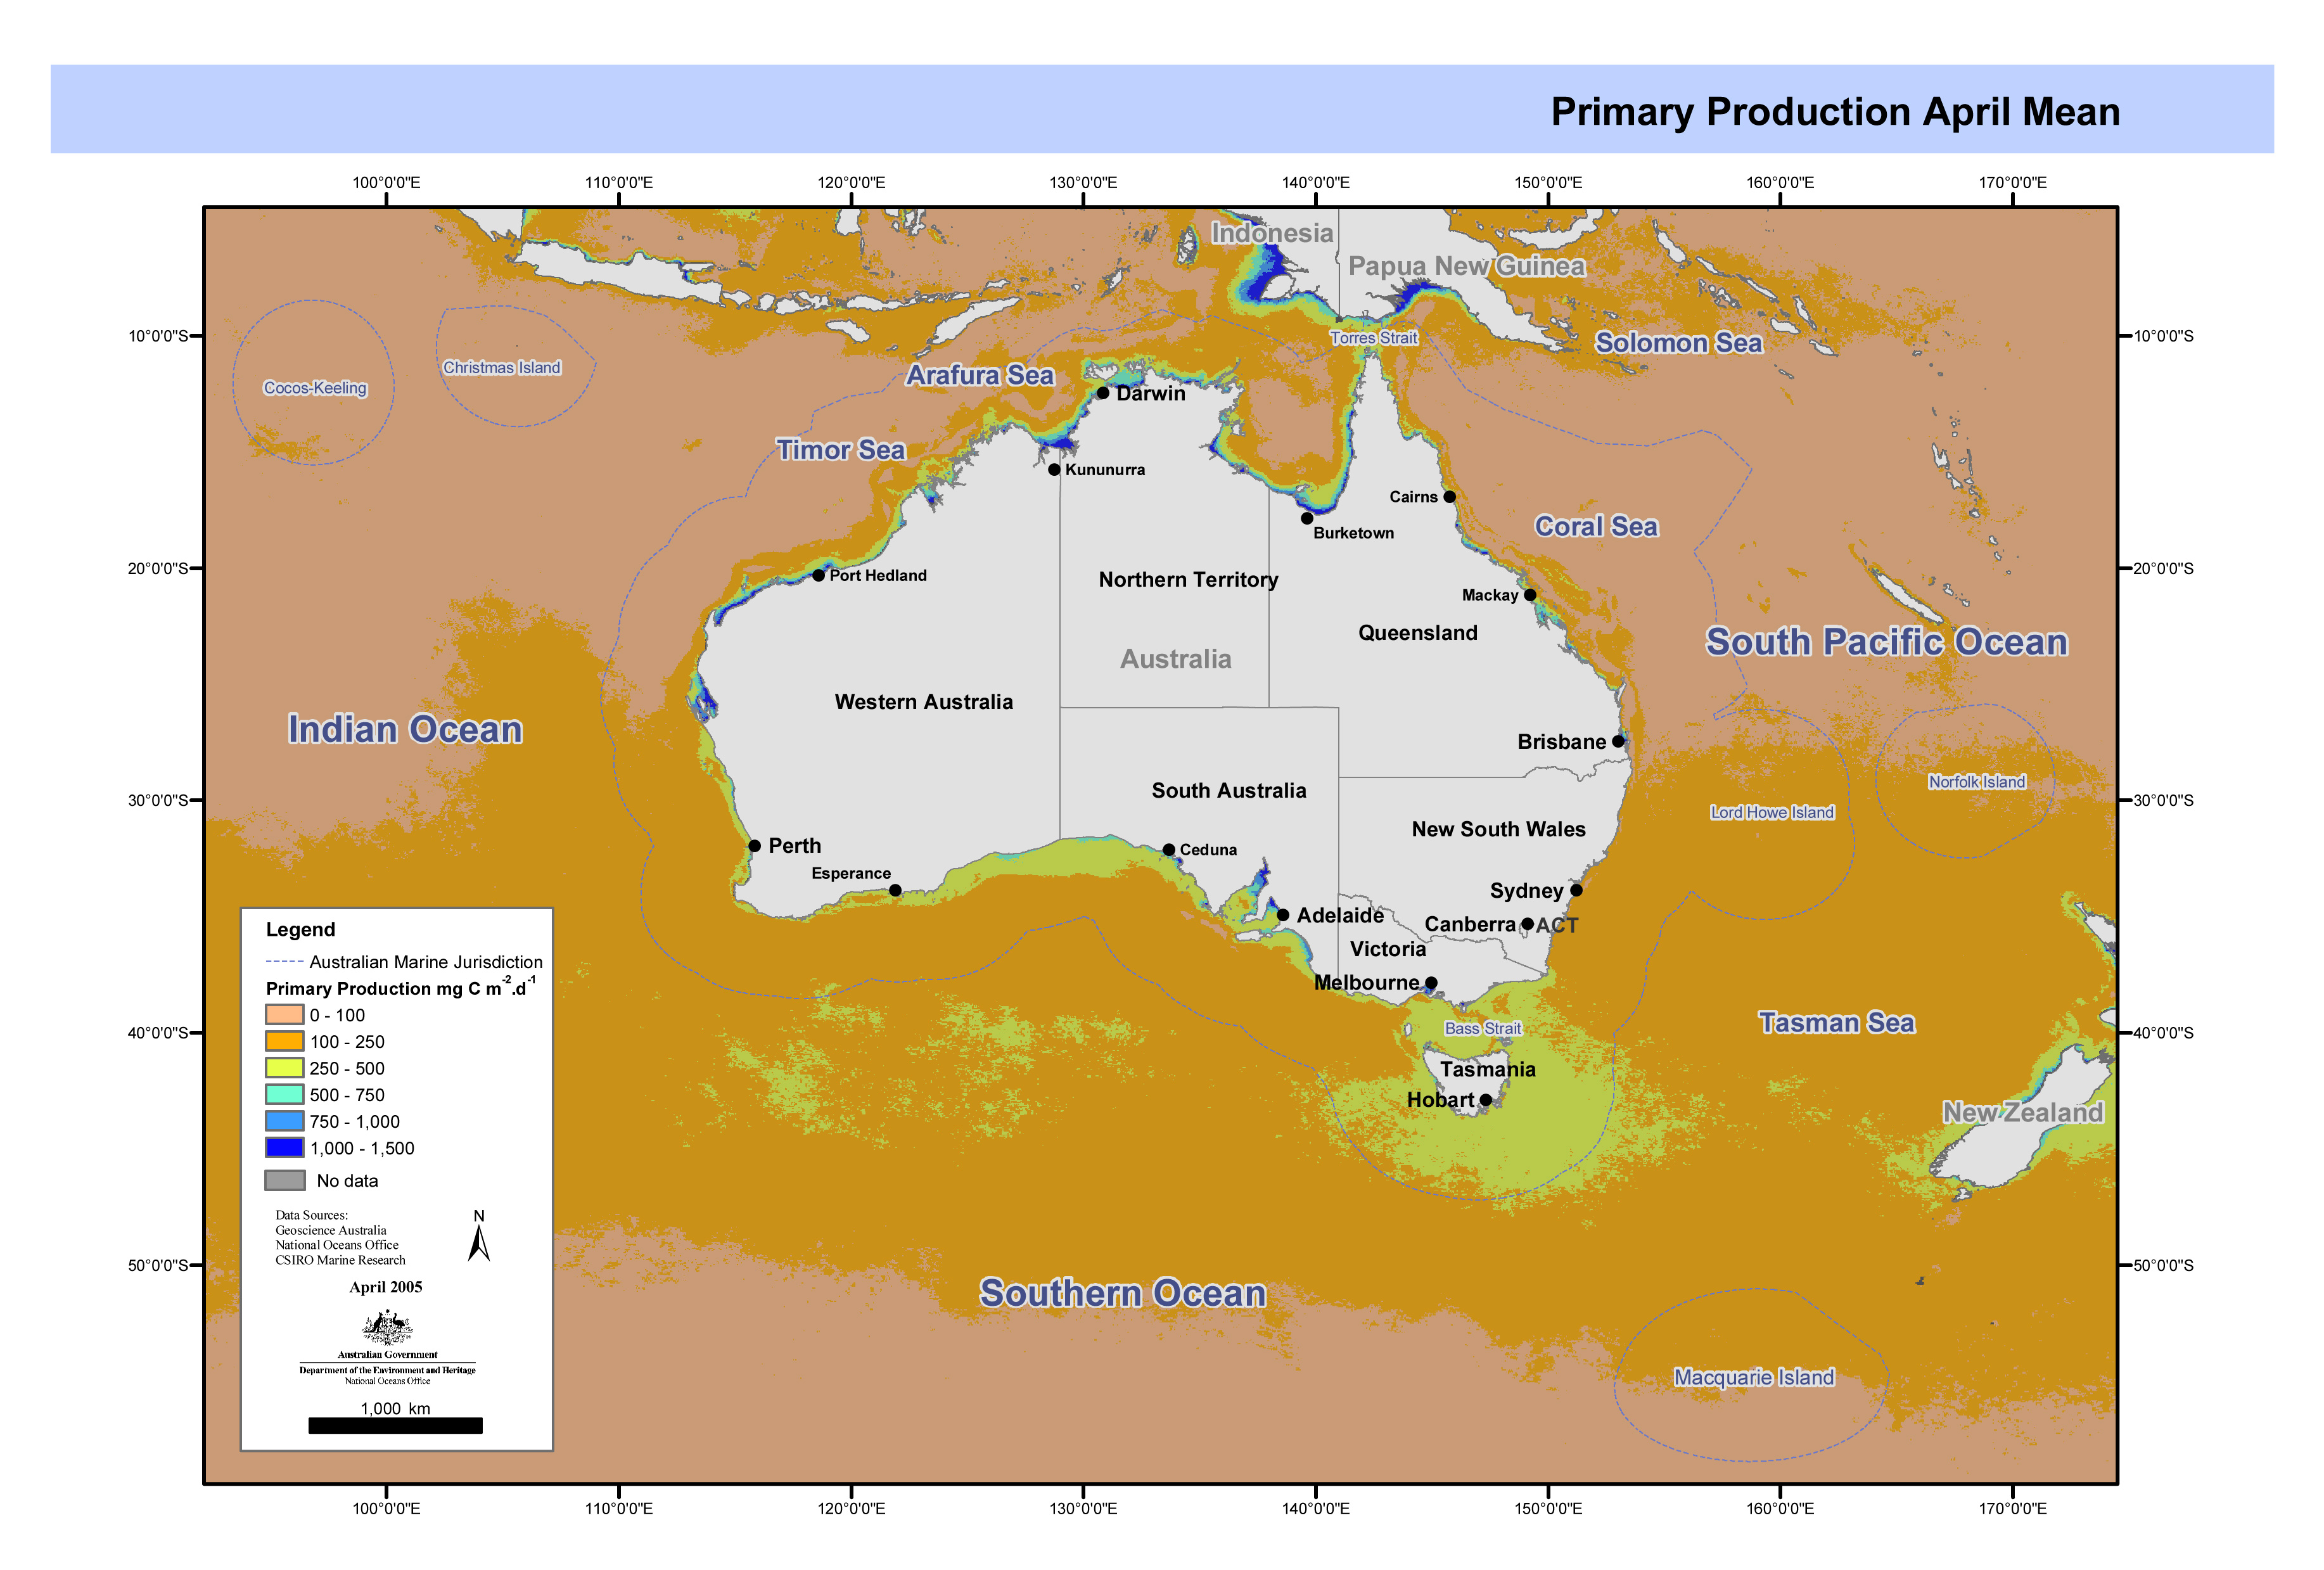
Set of maps showing ocean primary production in the Australian region extracted from global observations of ocean colour data from the moderate resolution imaging spectroradiometer (MODIS). These maps have been produced by CSIRO for the National Oceans Office, as part of an ongoing commitment to natural resource planning and management through the 'National Marine Bioregionalisation' project.
-
Coastal Zone Colour Scanner (CZCS) composited mean-monthly maps for the Australian EEZ region. The original NASA monthly composites have been processed by John Parslow and Chris Rathbone of the CSIRO Division of Fisheries to produce, for each month, images which are the mean over the 8 years of sampling. These have then been very simply remapped to a 1/2 degree grid, compatible with the "regional seasonal ocean physical property maps". The maps are all in units of pigment/m3.
-
Map showing annual mean ocean primary production extracted from global observations of ocean colour data from the moderate resolution imaging spectroradiometer (MODIS). This map has been produced by CSIRO for the National Oceans Office, as part of an ongoing commitment to natural resource planning and management through the 'National Marine Bioregionalisation' project.
-
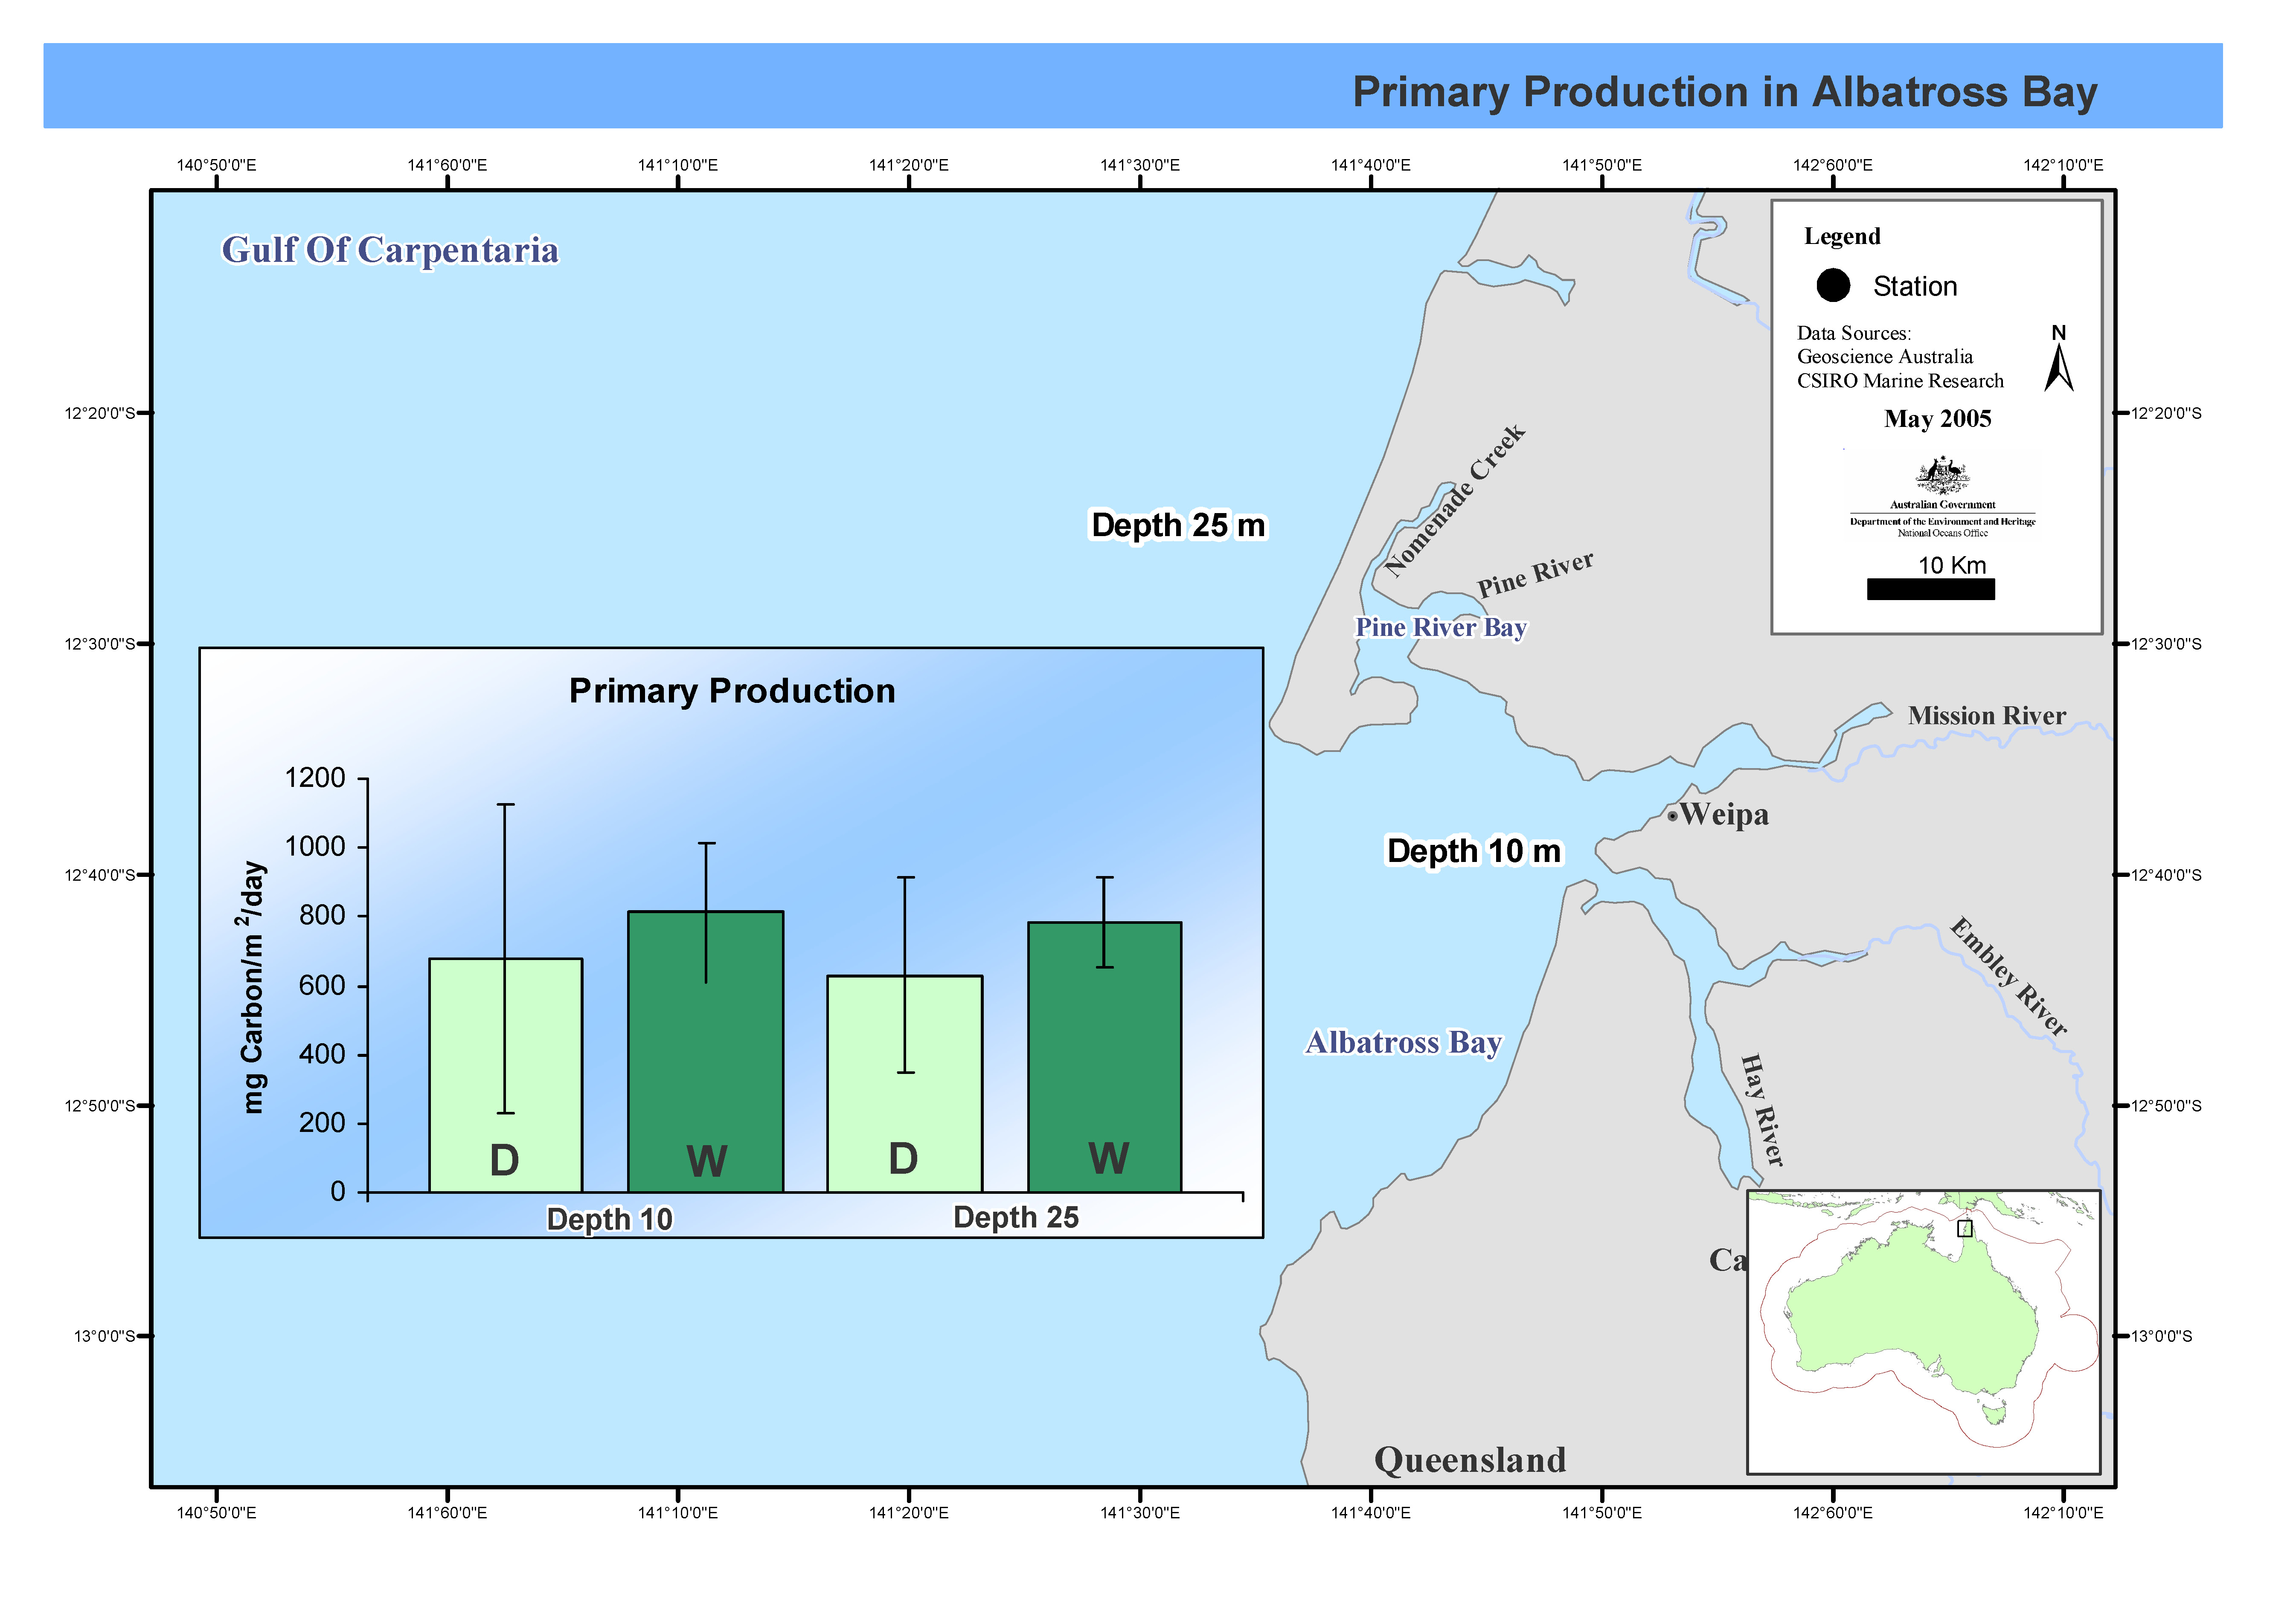
his map shows C14 primary productivity incubations at two stations over seven cruises in Albatross Bay during both the wet and dry seasons. Between February 1988 and February 1992 the FRV Jacqueline D completed nine cruises, seven in summer, two in winter, in Albatross Bay in the north-east Gulf of Carpentaria. Two stations, one 10m deep, the other at 25m, were sampled. Mean chlorophyll levels and primary productivity in the water column were measured. This map has been produced by CSIRO for the National Oceans Office, as part of an ongoing commitment to natural resource planning and management through the 'National Marine Bioregionalisation' project.
-
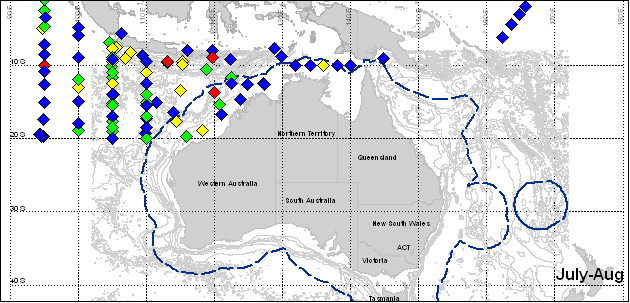
Mapset showing primary productivity in northern Australian waters. Data collected from oceanographic surveys conducted between 1959 and 1964 onboard the vessels "Gascoyne" and "Diamantina". Primary Production integrated to 100m, grams Carbon per spare metre per day. This map has been produced by CSIRO for the National Oceans Office, as part of an ongoing commitment to natural resource planning and management through the 'National Marine Bioregionalisation' project.
-
Data on primary productivity in the water column was collected during a 1988 cruise aboard the FRV "Franklin" in the Gulf of Carpentaria. Twenty stations were sampled.
-
This record is an overview entry for biological data collected on Diamantina cruise Dm 1/62. This cruise took place in the northeast Indian Ocean, Banda Sea and Java Sea during 12 February to 25 March 1962, under the leadership of B. Newell & D. Rochford. Biological data collected on this cruise include primary production rates; organisms with/without chlorophyll, total particles and occurrence of dinoflagellates from phytoplankton stations; pigment samples; and zooplankton biomass. Please note: This metadata record is a preliminary entry derived from information in the cruise report. Individual data types - which may span several cruises - will be indexed separately within this metadata system in due course.
-
This dataset contains data on species distributions, productivity, reproduction and growth of mangroves and saltmarshes from Jervis Bay, NSW. The data were obtained from a variety of surveys and measurement techniques between October 1988 and July 1991. Taxa identified comprised of about 130 vascular flora species, 15 of which are exotic. Species numbers range from 2 species in the mangroves to more than 80 in the fringe forest. Population structures of the 5 dominant species - Avicennia marina, Aegiceras corniculatum, Casuarina glauca, Sclerostegia arbuscula and Gahnia filum vary spatially. Temporal change in populations of Avicennia has occurred over time intervals of 20 years, the other species appear to have remained stable over the past 50 years. 13 maps on the mangrove and saltmarsh complexes have been prepared at a scale of 1:4000. The Jervis Bay mangroves and saltmarshes were compared with other locations around Batemans Bay and Port Hacking. NB - As the database has been lost, the only data still available are those published in the JERVIS BAY BASELINE STUDIES Final Report.
