Keyword
Earth Science | Oceans | Ocean Waves | Wave Height
6 record(s)
Type of resources
Topics
Keywords
Contact for the resource
Provided by
Formats
Update frequencies
Status
draft
-
ESRI grid showing wave height and period using satellite derived wave data generated from the Australian Bureau of Meteorology's Wave Model (WAM). This grid has been produced by CSIRO for the National Oceans Office, as part of an ongoing commitment to natural resource planning and management through the 'National Marine Bioregionalisation' project. Data from National Geophysical Data Centre (NGDC) has been supplemented where loss of coverage has occurred in the deep ocean regions.
-

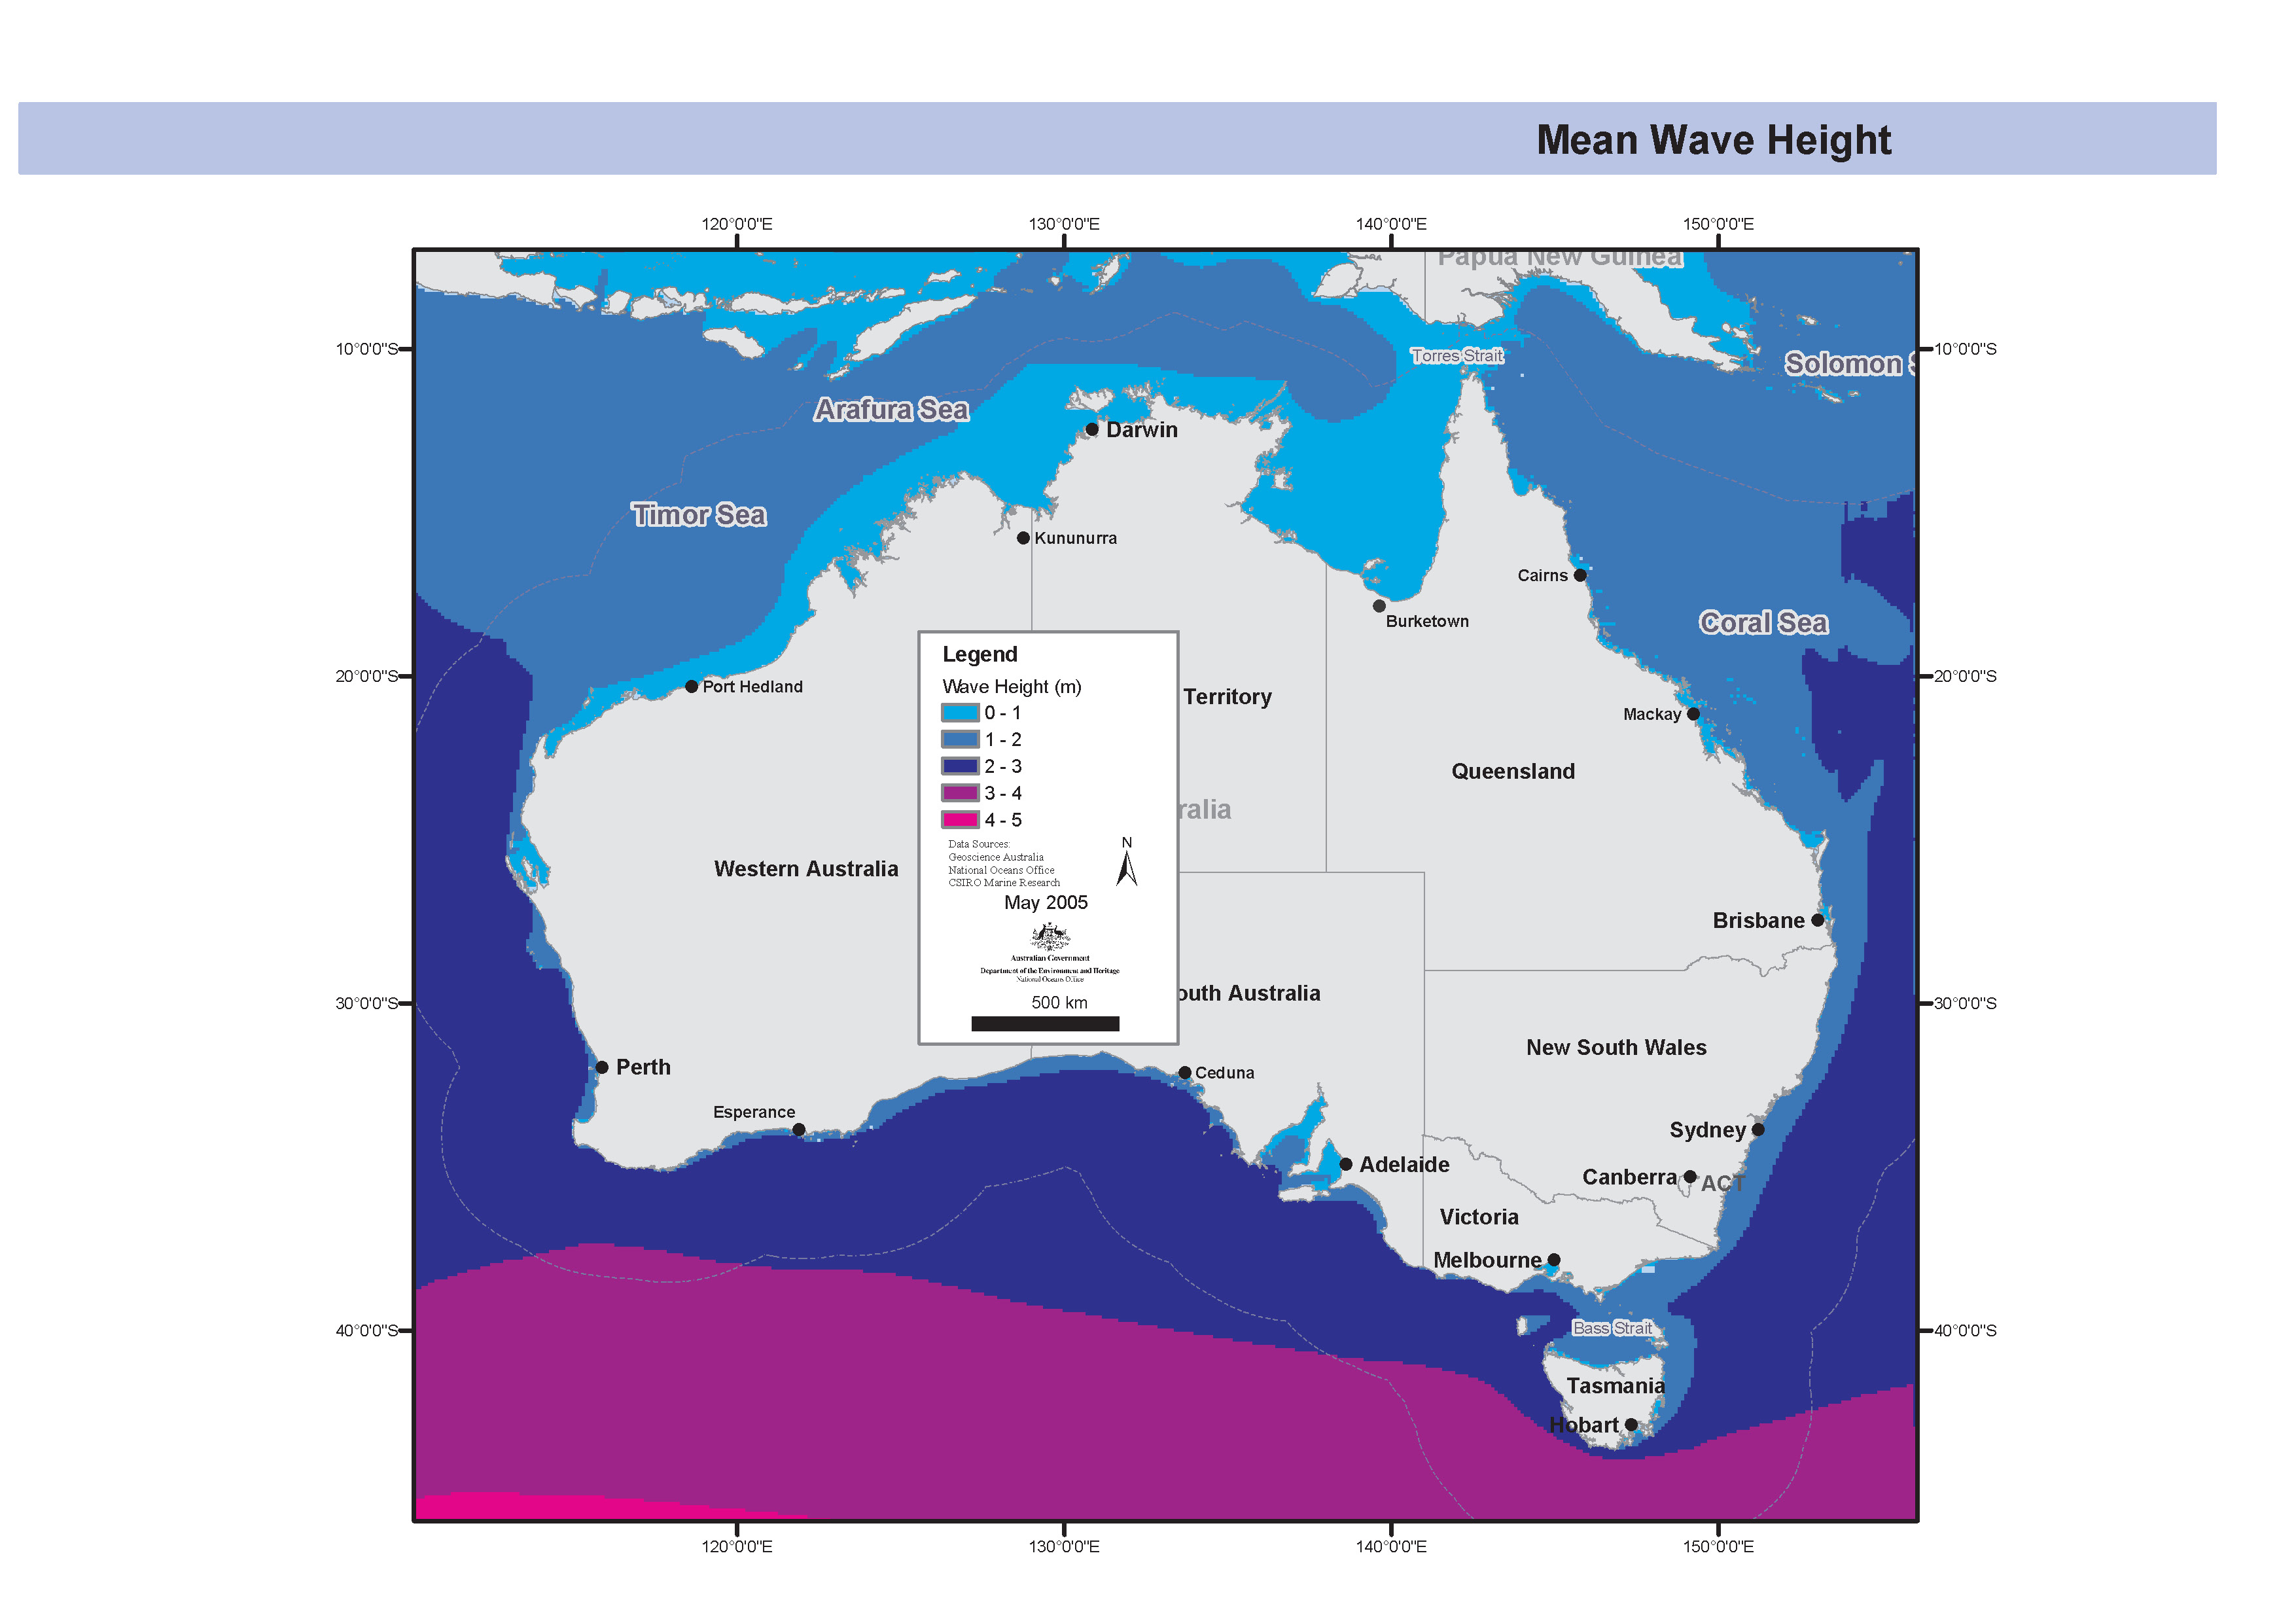
Map showing the annual mean wave height period using satellite derived wave height data generated from the Australian Bureau of Meteorology's Wave Model (WAM). This map has been produced by CSIRO for the National Oceans Office, as part of an ongoing commitment to natural resource planning and management through the 'National Marine Bioregionalisation' project. Variations in onscreen colour representation or printed reproduction may affect perception of the contained data.
-

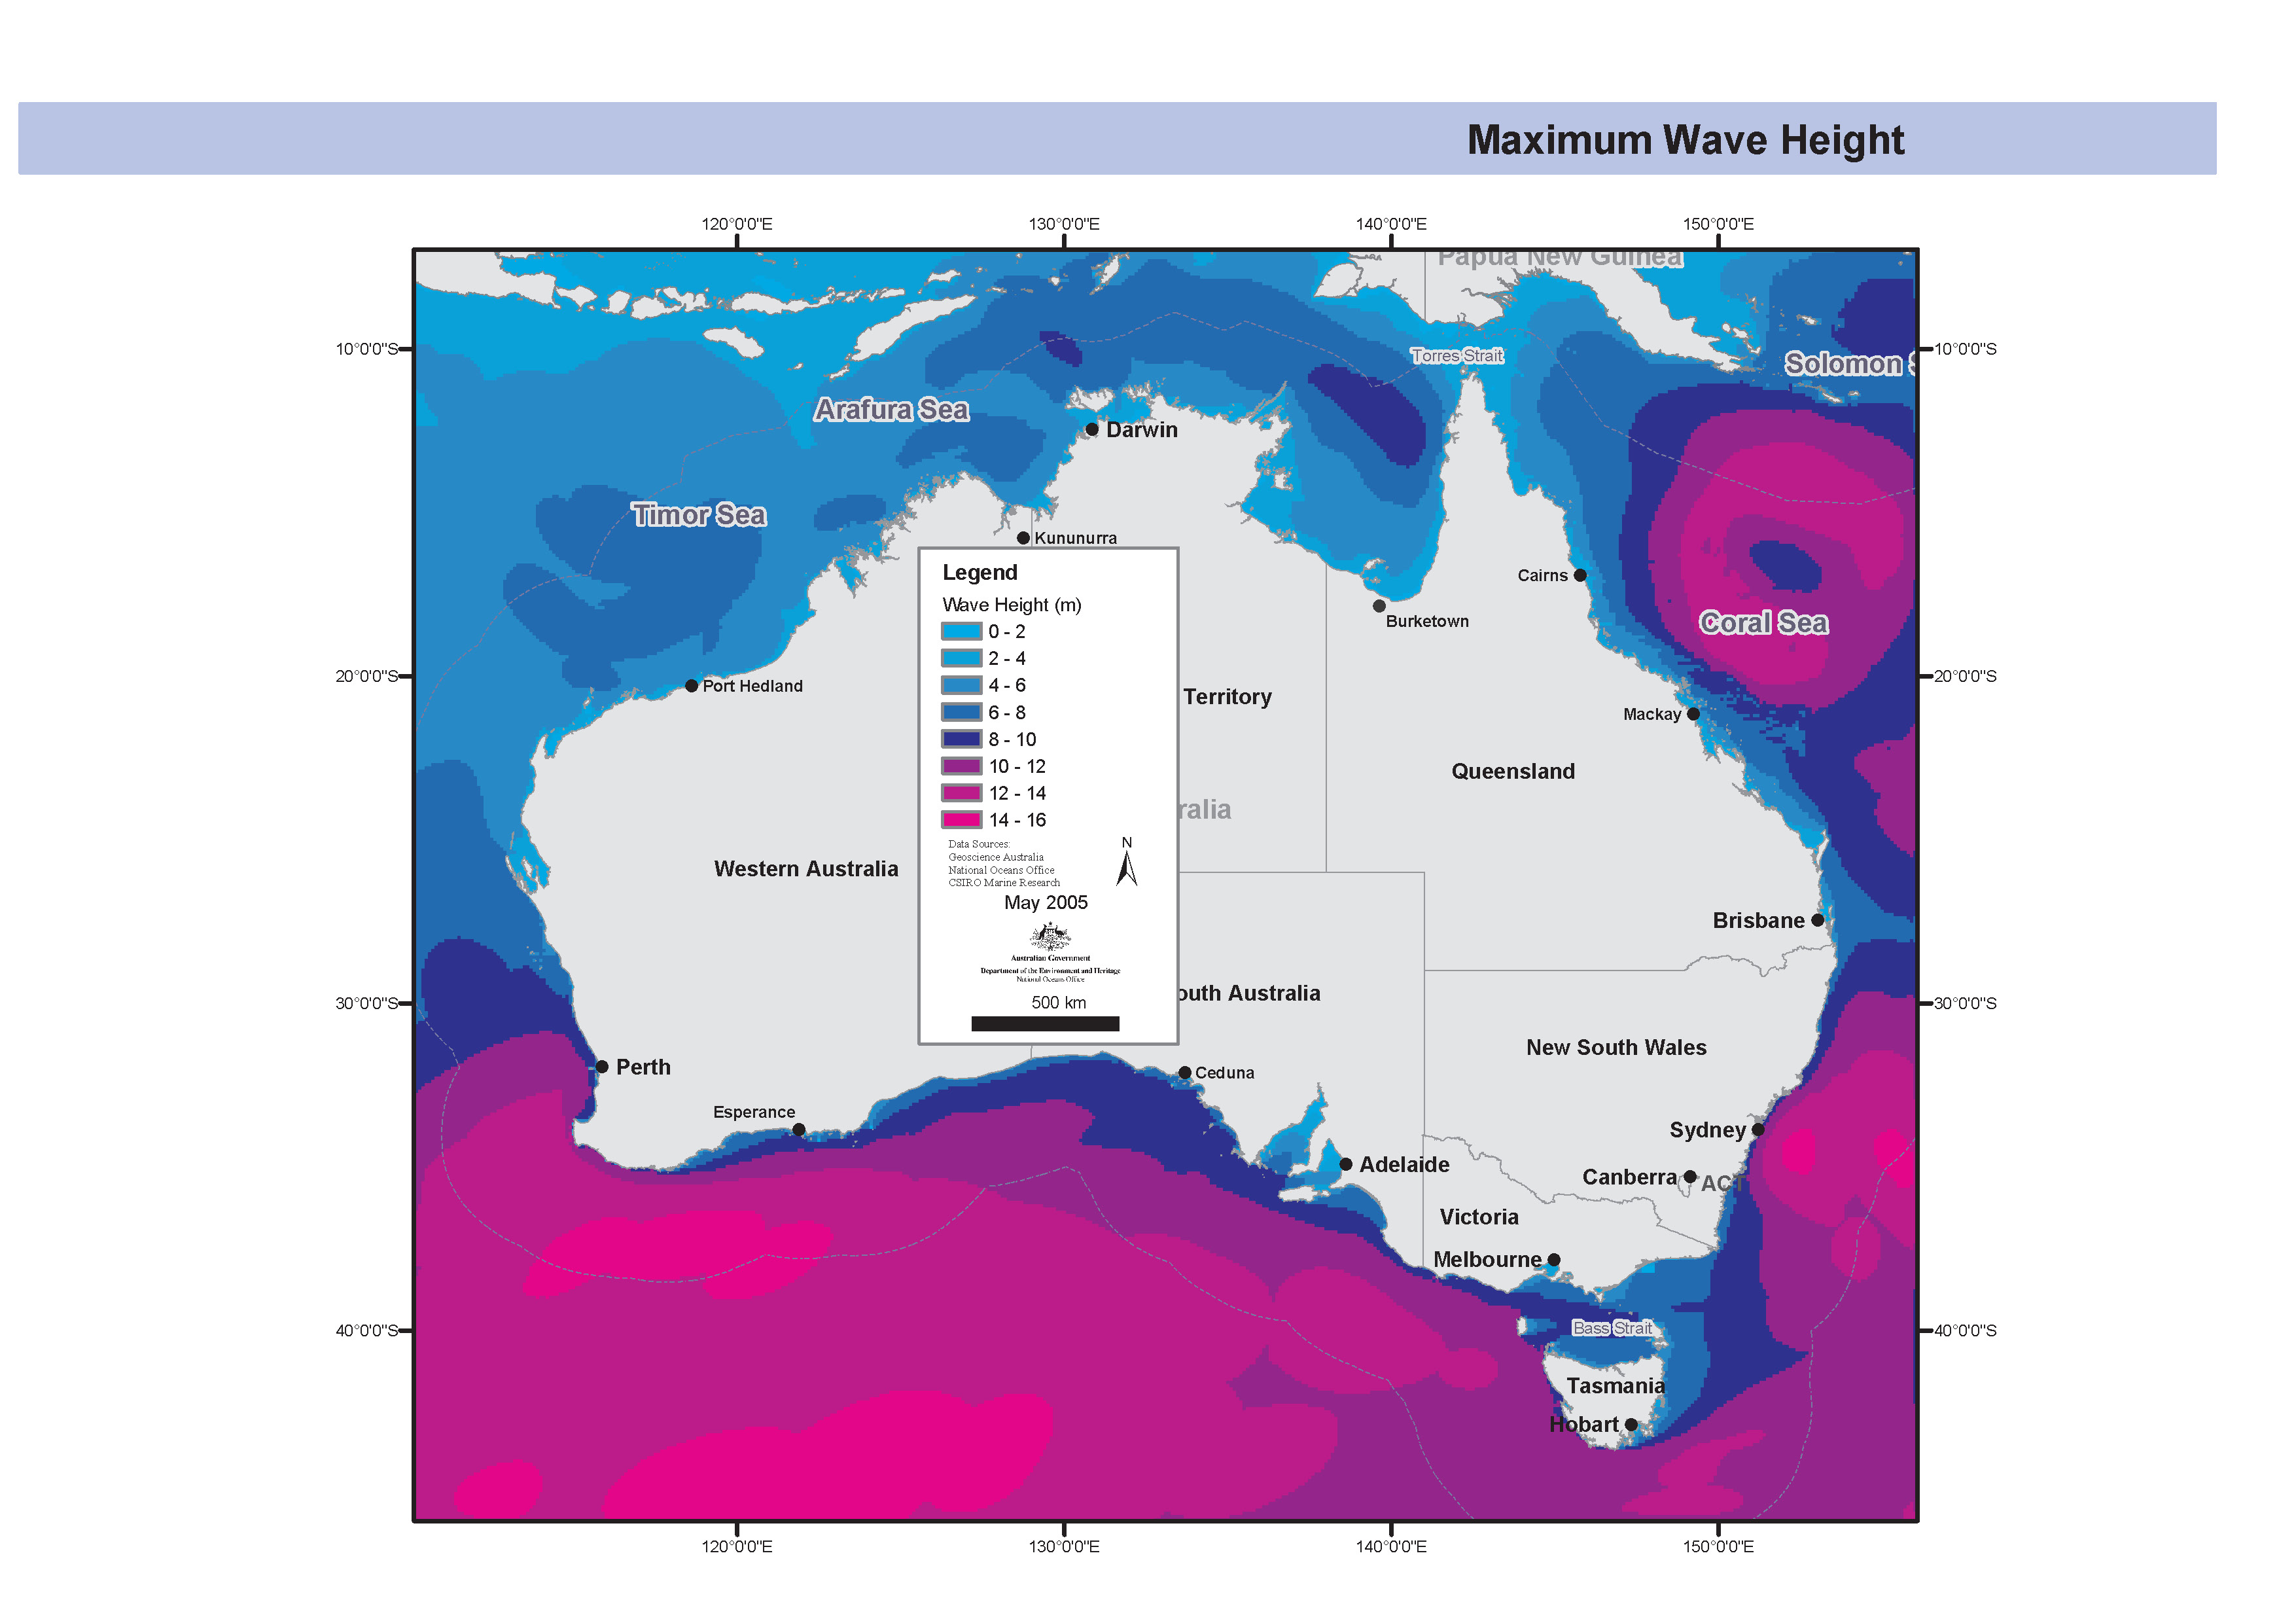
Map showing the annual maximum wave height using satellite derived wave height data generated from the Australian Bureau of Meteorology's Wave Model (WAM). This map has been produced by CSIRO for the National Oceans Office, as part of an ongoing commitment to natural resource planning and management through the 'National Marine Bioregionalisation' project. Variations in onscreen colour representation or printed reproduction may affect perception of the contained data.
-
In July 1985 the Division of Oceanography embarked on a wave observation program with the deployment of two "Waverider" buoys in the Southern Ocean near Cape Sorell on the west coast of Tasmania. Data were collected from moored Waverider Buoys deployed for various periods in Tasmanian coastal waters off Cape Grim, Cape Sorell (100m), Cape Sorell (50m) and Storm Bay. These observations are used to assess both typical and extreme sea states at these sites and for estimating spatial, seasonal and interannual variations in wave conditions in the Tasmanian region. The program concluded in December 1993 when the Storm Bay buoy ceased operation. There are two distinct datasets: a) Derived statistical data is available on-line for the seven locations mentioned in "Wave Climate Measurements in the Southern Ocean." b) Sample burst data for each of (possibly) nine locations. NOTES: All instruments used, and a copy of the data obtained during this program were sent to the Bureau of Meteorology. The Marine Observation Unit at the Bureau (marine_obs@bom.gov.au) may be able to provide additional information. The data files in this collection are not in a Datacente supported format and no assurances are given as to the accuracy of data, or of the locations implied by the data file names. The CSIRO Waverider program has not been continued.
-
This work describes the physical oceanography at successively smaller scales, from that of the eastern Indian Ocean, to the shelf from NW Cape to Cape Leeuwin, down to the Marmion lagoon. At the largest scale, the primary tool is the global Ocean Forecasting Australia Model (OFAM), that has coarse (>2 degree) resolution distant from Australia, but has 0.1 degree (~10 km) resolution in the Australasian region. Being global, OFAM simulates the longshore pressure gradient, largely due to the Indonesian Throughflow, that drives the Leeuwin Current southward along the shelf break of the WA coast. The model provides good qualitative representation of the Leeuwin Current and its associated eddies but, at 10 km resolution, tends to underestimate the current speeds on the shelf and cross-shore fluxes. OFAM output has been corrected with observations (in a separate CSIRO project) and archived to provide nearly 2 decades of ocean conditions. As a prelude to later biological investigations, it is used to investigate the longshore connectivity of shelf waters, demonstrating that the shelf can be classified into several sections of alternating low and high retention. At this scale, openocean swells are important, with biological particles near the surface being driven north-east under their influence. At the next level, the Rutgers Ocean Modelling System (ROMS) is nested inside OFAM, covering the southern west shelf, with resolution down to 2 km near the coast. ROMS produces similar patterns of circulation to OFAM, but the Leeuwin Current and inshore wind-driven currents are narrower and stronger. The ROMS model is used primarily to drive a model of primary productivity over the shelf. ROMS produces eddies that correspond well with those observed in sea-surface temperature images, and also shows instances of intermittent upwelling along the shelf break. Upwelling and eddy transport prove to be significant mechanisms for moving nutrients and phytoplankton on and off the shelf, respectively. At the scale of the Marmion lagoon, surface waves breaking on the reefs drive currents in the lagoon. The present study incorporated a year-long measurement program to quantify the reef and lagoon circulation. At low wave heights, the lagoonal circulation is driven primarily by longshore winds. However, when the incoming waves are higher than about 1.5 m, they break on the reef, carrying water into the lagoon, and causing currents to the north and south out of the lagoon. Modelling of reef dynamics requires very high resolution, down to tens of metres, and a model that includes both waves and currents. Two model configurations have been used in the present study: ROMS together with the wave model SWAN, and Xbeach, a littoral-zone model still under development at Delft University. Xbeach accurately represents the lagoonal dynamics.
-
This dataset contains data on fish distributions and occurrences from Jervis Bay, NSW. The data were obtained from sandy beaches around Jervis Bay between October 1988 and July 1991. Beach seine and beam trawl surveys were conducted every 3 months for 3 years. Taxa identified comprised 97 fish species (including 41 species sought by commercial or recreational fishermen and 12 species classified as baitfish) and 14 invertebrate species. Baitfish (predominantly small, schooling species) made up 94% of the total fish catch, and valued fish 6%. Environmental correlations (including water temperature, salinity, waves, clarity, light wind and time of day were examined for various types of fish and invertebrates, and two common fish species Myxus elongatus and Sillago ciliata in particular. The Jervis Bay sandy beach faunas were compared with those over Posidonia beds and in nearby creeks, and with other beaches in Port Hacking and Batemans Bay. NB - As the database has been lost, the only data still available are those published in the JERVIS BAY BASELINE STUDIES Final Report.
