Keyword
Earth Science | Oceans | Ocean Circulation | Ocean Mixed Layer
17 record(s)
Type of resources
Topics
Keywords
Contact for the resource
Provided by
Formats
Update frequencies
Status
draft
-

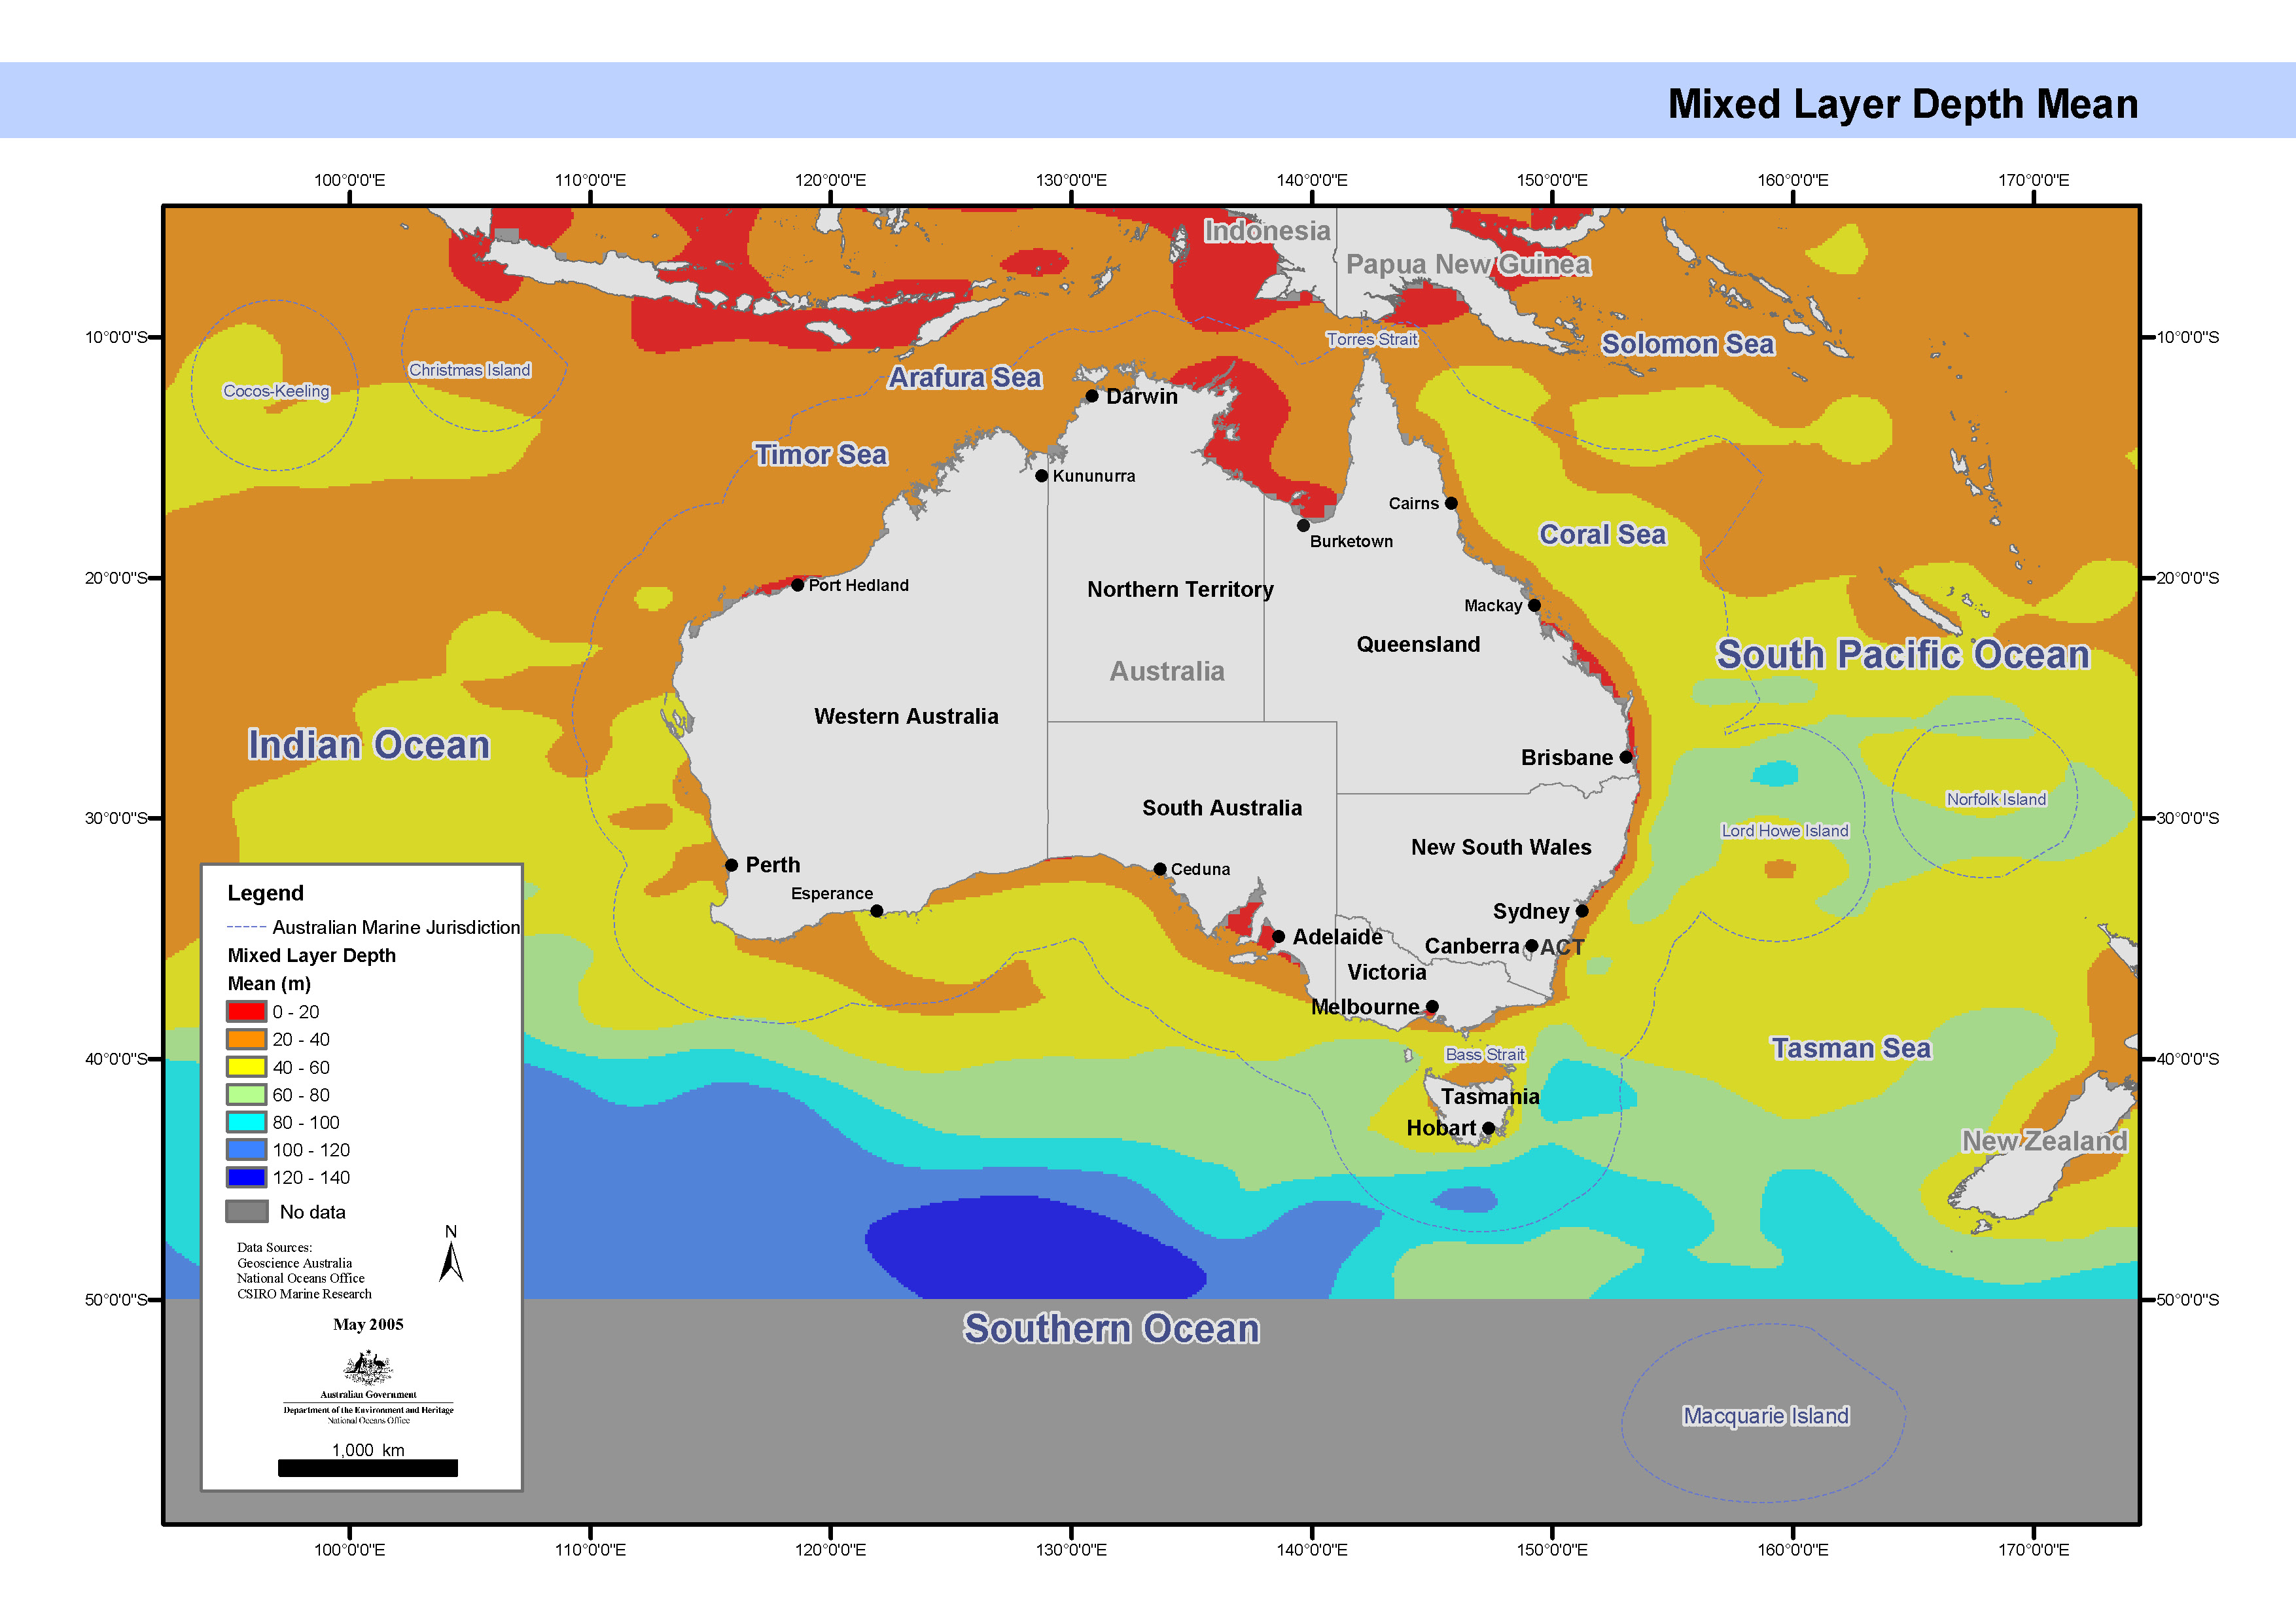
Map showing the ocean mixed layer depth annual mean, calculated from the oceanographic temperature and salinity cast data used to generate CARS2000. This map has been produced by CSIRO for the National Oceans Office, as part of an ongoing commitment to natural resource planning and management through the 'National Marine Bioregionalisation' project. CARS2000 is derived from ocean cast data, which is always measured above the sea floor. However, for properties which do not change rapidly near the sea floor, this would not lead to a significant
-
ESRI grids showing the ocean Mixed Layer Depth annual amplitude and annual mean, calculated from the oceanographic temperature and salinity cast data used to generate CARS2000. These grids have been produced by CSIRO for the National Oceans Office, as part of an ongoing commitment to natural resource planning and management through the 'National Marine Bioregionalisation' project. CARS2000 is derived from ocean cast data, which is always measured above the seafloor. However, for properties which do not change rapidly near the seafloor, this would not lead to a significant error.
-

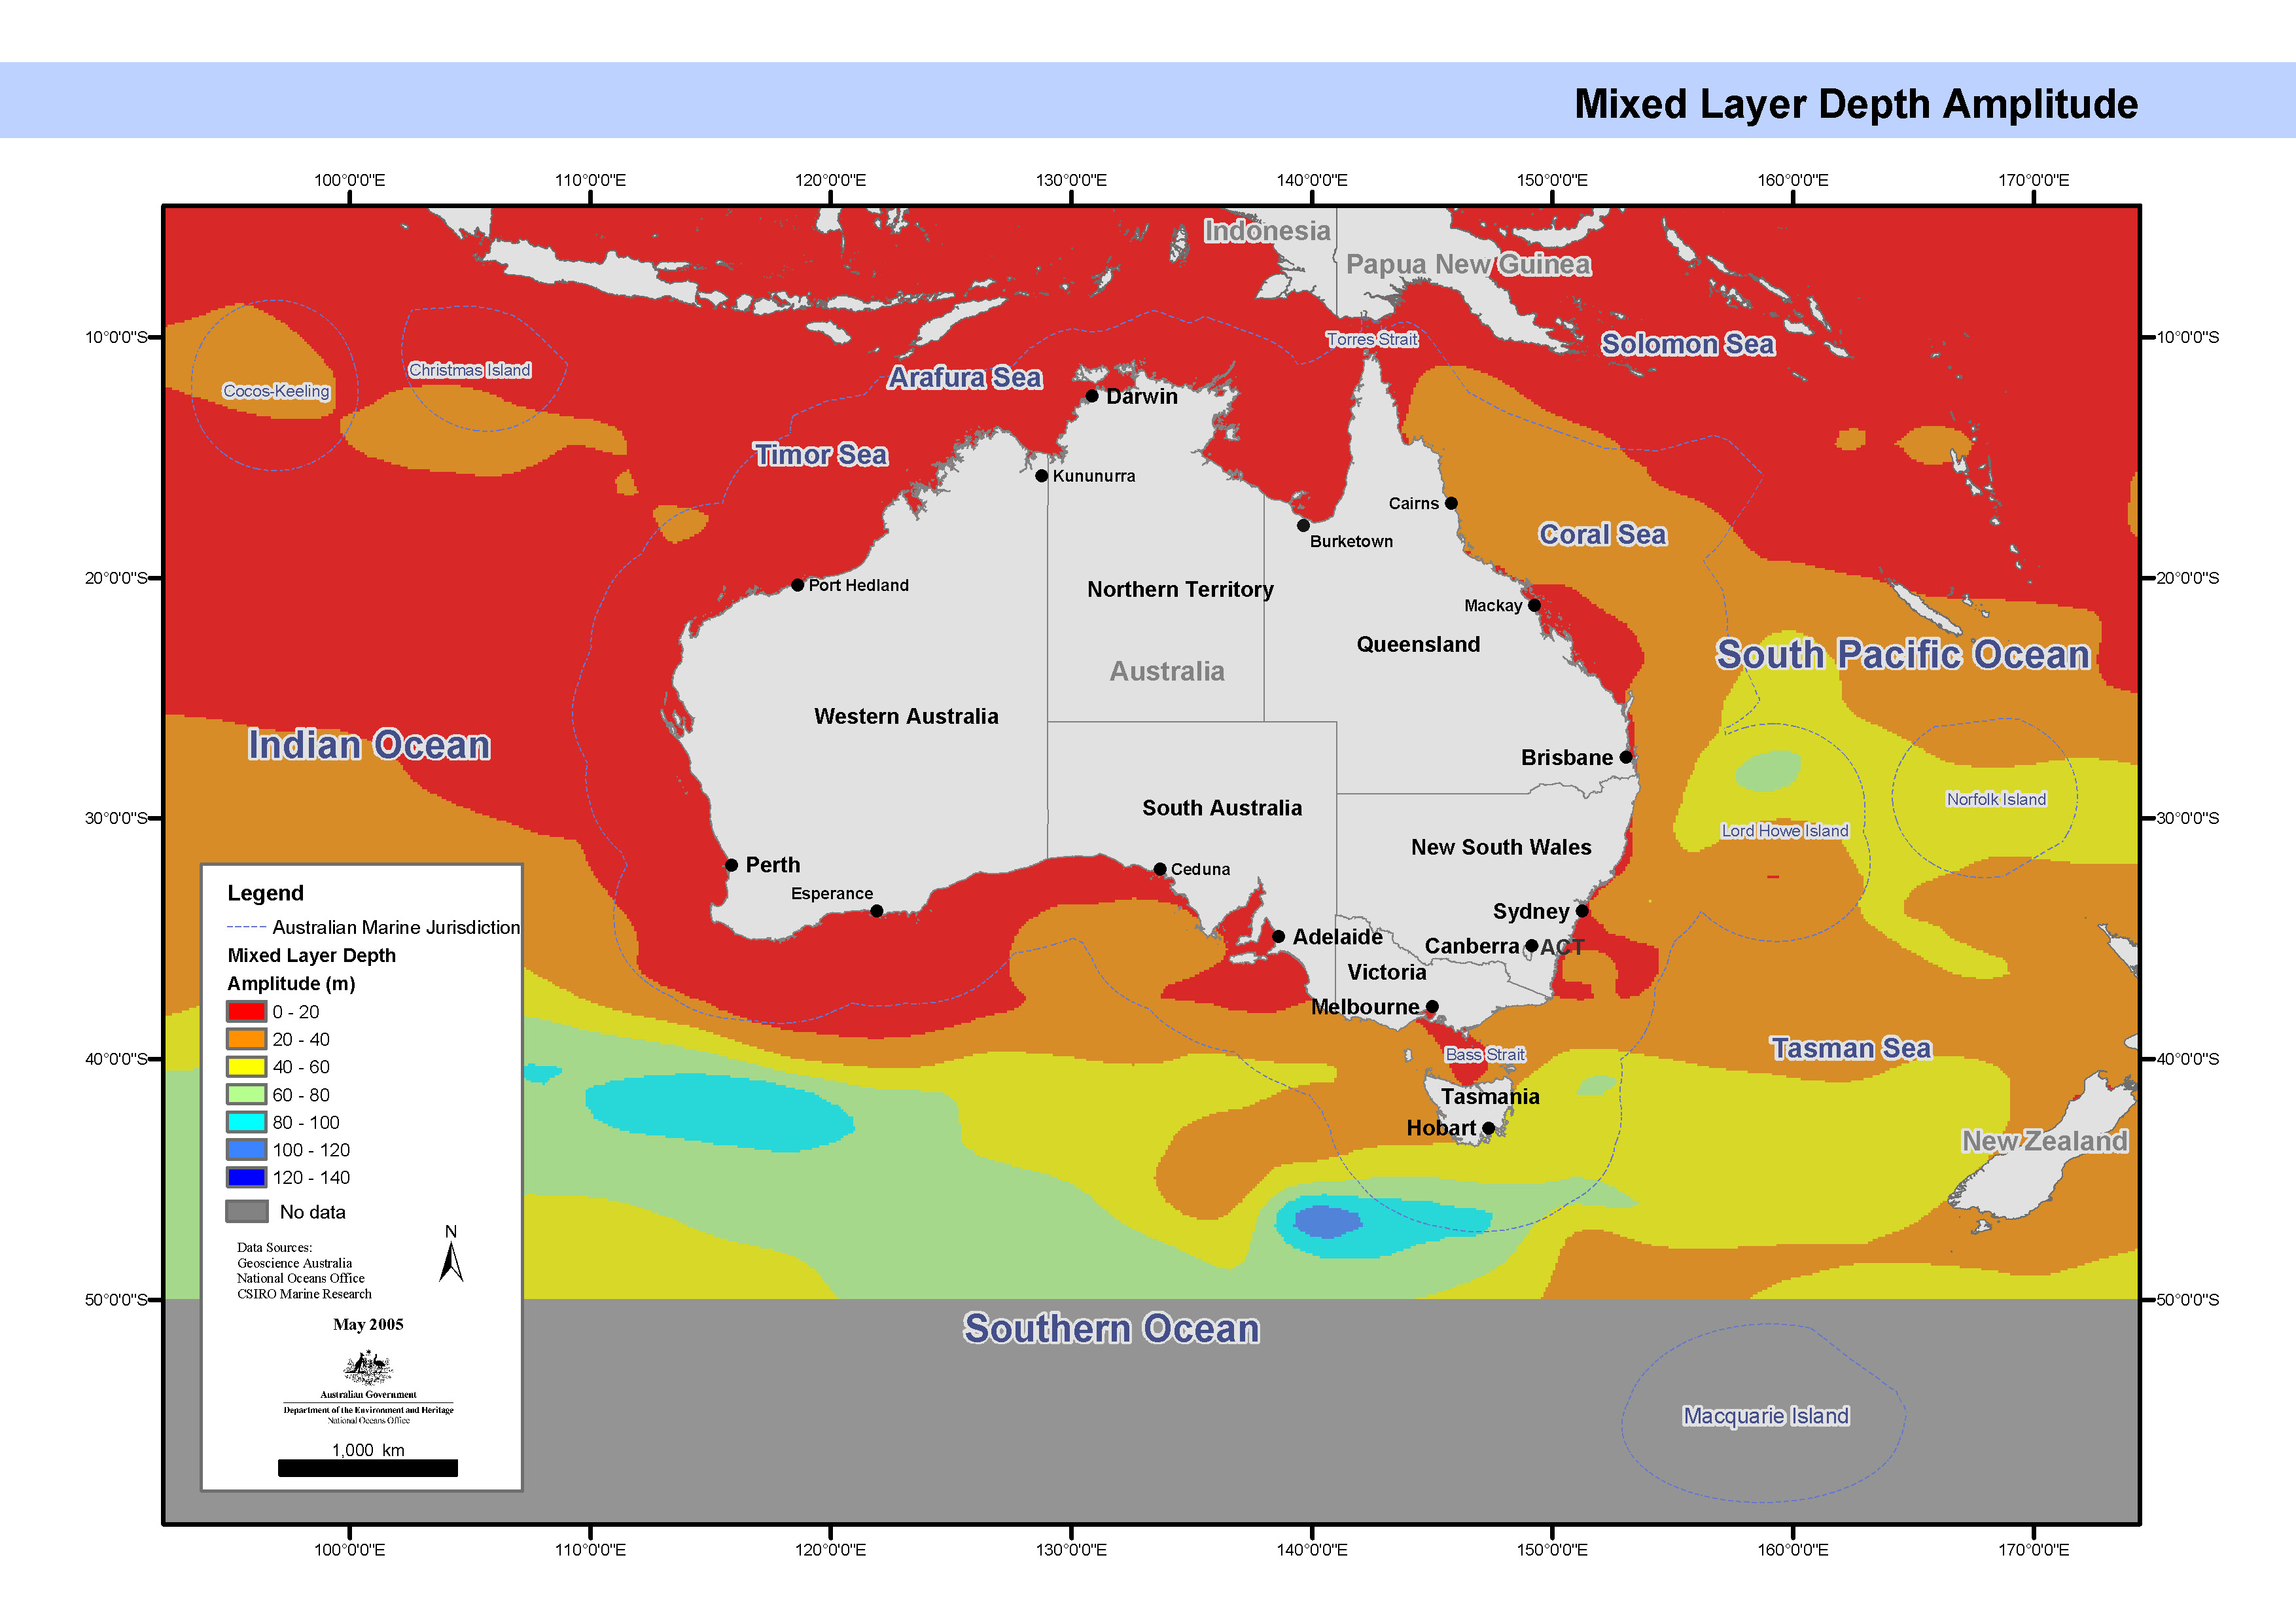
Map showing the ocean mixed layer depth annual amplitude, calculated from the oceanographic temperature and salinity cast data used to generate CARS2000. This map has been produced by CSIRO for the National Oceans Office, as part of an ongoing commitment to natural resource planning and management through the 'National Marine Bioregionalisation' project. CARS2000 is derived from ocean cast data, which is always measured above the sea floor. However, for properties which do not change rapidly near the sea floor, this would not lead to a significant error.
-
Mixed layer depth was calculated from the oceanographic temperature and salinity cast data used to generate CARS2000. It was defined to be the minimum (shallower) depth of depths zt and zs, where zt and zs are the shallowest depths such that abs(T(zt)-T(10m)) >= .4C and abs(S(zs)-S(10m)) >= 0.03 PSU. These values were then mapped onto a regular .5 degree grid using a loess filter, as used in CARS2000, simultaneously fitting quadratic spatial functions and annual harmonics. These fields were then linearly interpolated to the required 1/10th degree spatial resolution. The provided "annual amplitude" is simply the magnitude of the fitted annual sinusoid. CARS is a set of seasonal maps of temperature, salinity, dissolved oxygen, nitrate, phosphate and silicate, generated using Loess mapping from all available oceanographic data in the region. It covers the region 100-200E, 50-0S, on a 0.5 degree grid, and on 56 standard depth levels. Higher resolution versions are also available for the Australian continental shelf. The data was obtained from the World Ocean Atlas 98 and CSIRO Marine and NIWA archives. It was designed to improve on the Levitus WOA98 Atlas, in the Australian region.
-
The eddy-resolving Ocean Forecasting Australia Model (OFAM) is used to downscale future climate projections by CSIRO Mk3.5 climate model under scenario A1B for the 2060s. A simulation run without relaxation and another run with relaxation to expected sea surface temperature and sea surface salinity are archived with 3D fields of ocean temperature, salinity, currents, and sea surface height.
-
The eddy-resolving Ocean Forecasting Australia Model (OFAM) is used to downscale future climate projections by CSIRO Mk3.5 climate model under scenario A1B for the 2060s.
-
OFAM is based on version 4.0d of the Modular Ocean Model, using a hybrid mixed layer model. The horizontal grid has 1191 and 968 points in the zonal and meridional directions respectively; with 1/10 degree horizontal resolution around Australia (90-180E, south of 17). Outside of this domain, the horizontal resolution decreases to 0.9 degrees across the Pacific and Indian basins (to 10E, 60W and 40N) and to 2 degrees in the Atlantic Ocean. OFAM has 47 vertical levels, with 10 m resolution down to 200 m depth. The topography for OFAM is a composite of topography sources including dbdb2 and GEBCO. Horizontal diffusion is zero. Horizontal viscosity is resolution and state-dependent according to the Smagorinsky viscosity scheme (Griffies and Hallberg 2000). BRAN is a multi-year integration of OFAM that assimilates observations using an ensemble optimal interpolation (EnOI) scheme that uses a stationary ensemble of intraseasonal model anomalies, obtained from a non-assimilating model run. Observations include along-track SLA (atSLA) from altimeters and tide gauges, in situ T and S observations and satellite SST.
-
This dataset contains temperature data from the West Indian Ocean. Data (including available XBT data) were collected since 1778. They have been subjected to quality control as an activity of CSIRO and BoM.
-
A MATLAB routine (readBRAN) was created to ease accessing the BRAN data for analysis and use. Particle tracking was done using the velocity data in BRAN to investigate the source and sinks of the Leeuwin Current waters.
-
A MATLAB routine (readBRAN) was created to ease accessing the BRAN data for analysis and use. The BRAN model data was compared with the SRFME mooring data to valid the model results.
