Keyword
Earth Science | Oceans | Ocean Circulation | Fronts
14 record(s)
Type of resources
Topics
Keywords
Contact for the resource
Provided by
Formats
Update frequencies
Status
draft
-
ESRI grid showing homogeneity, heterogeneity, eddie activity and frontal activity. This grid has been produced by CSIRO for the National Oceans Office, as part of an ongoing commitment to natural resource planning and management through the 'National Marine Bioregionalisation' project.
-

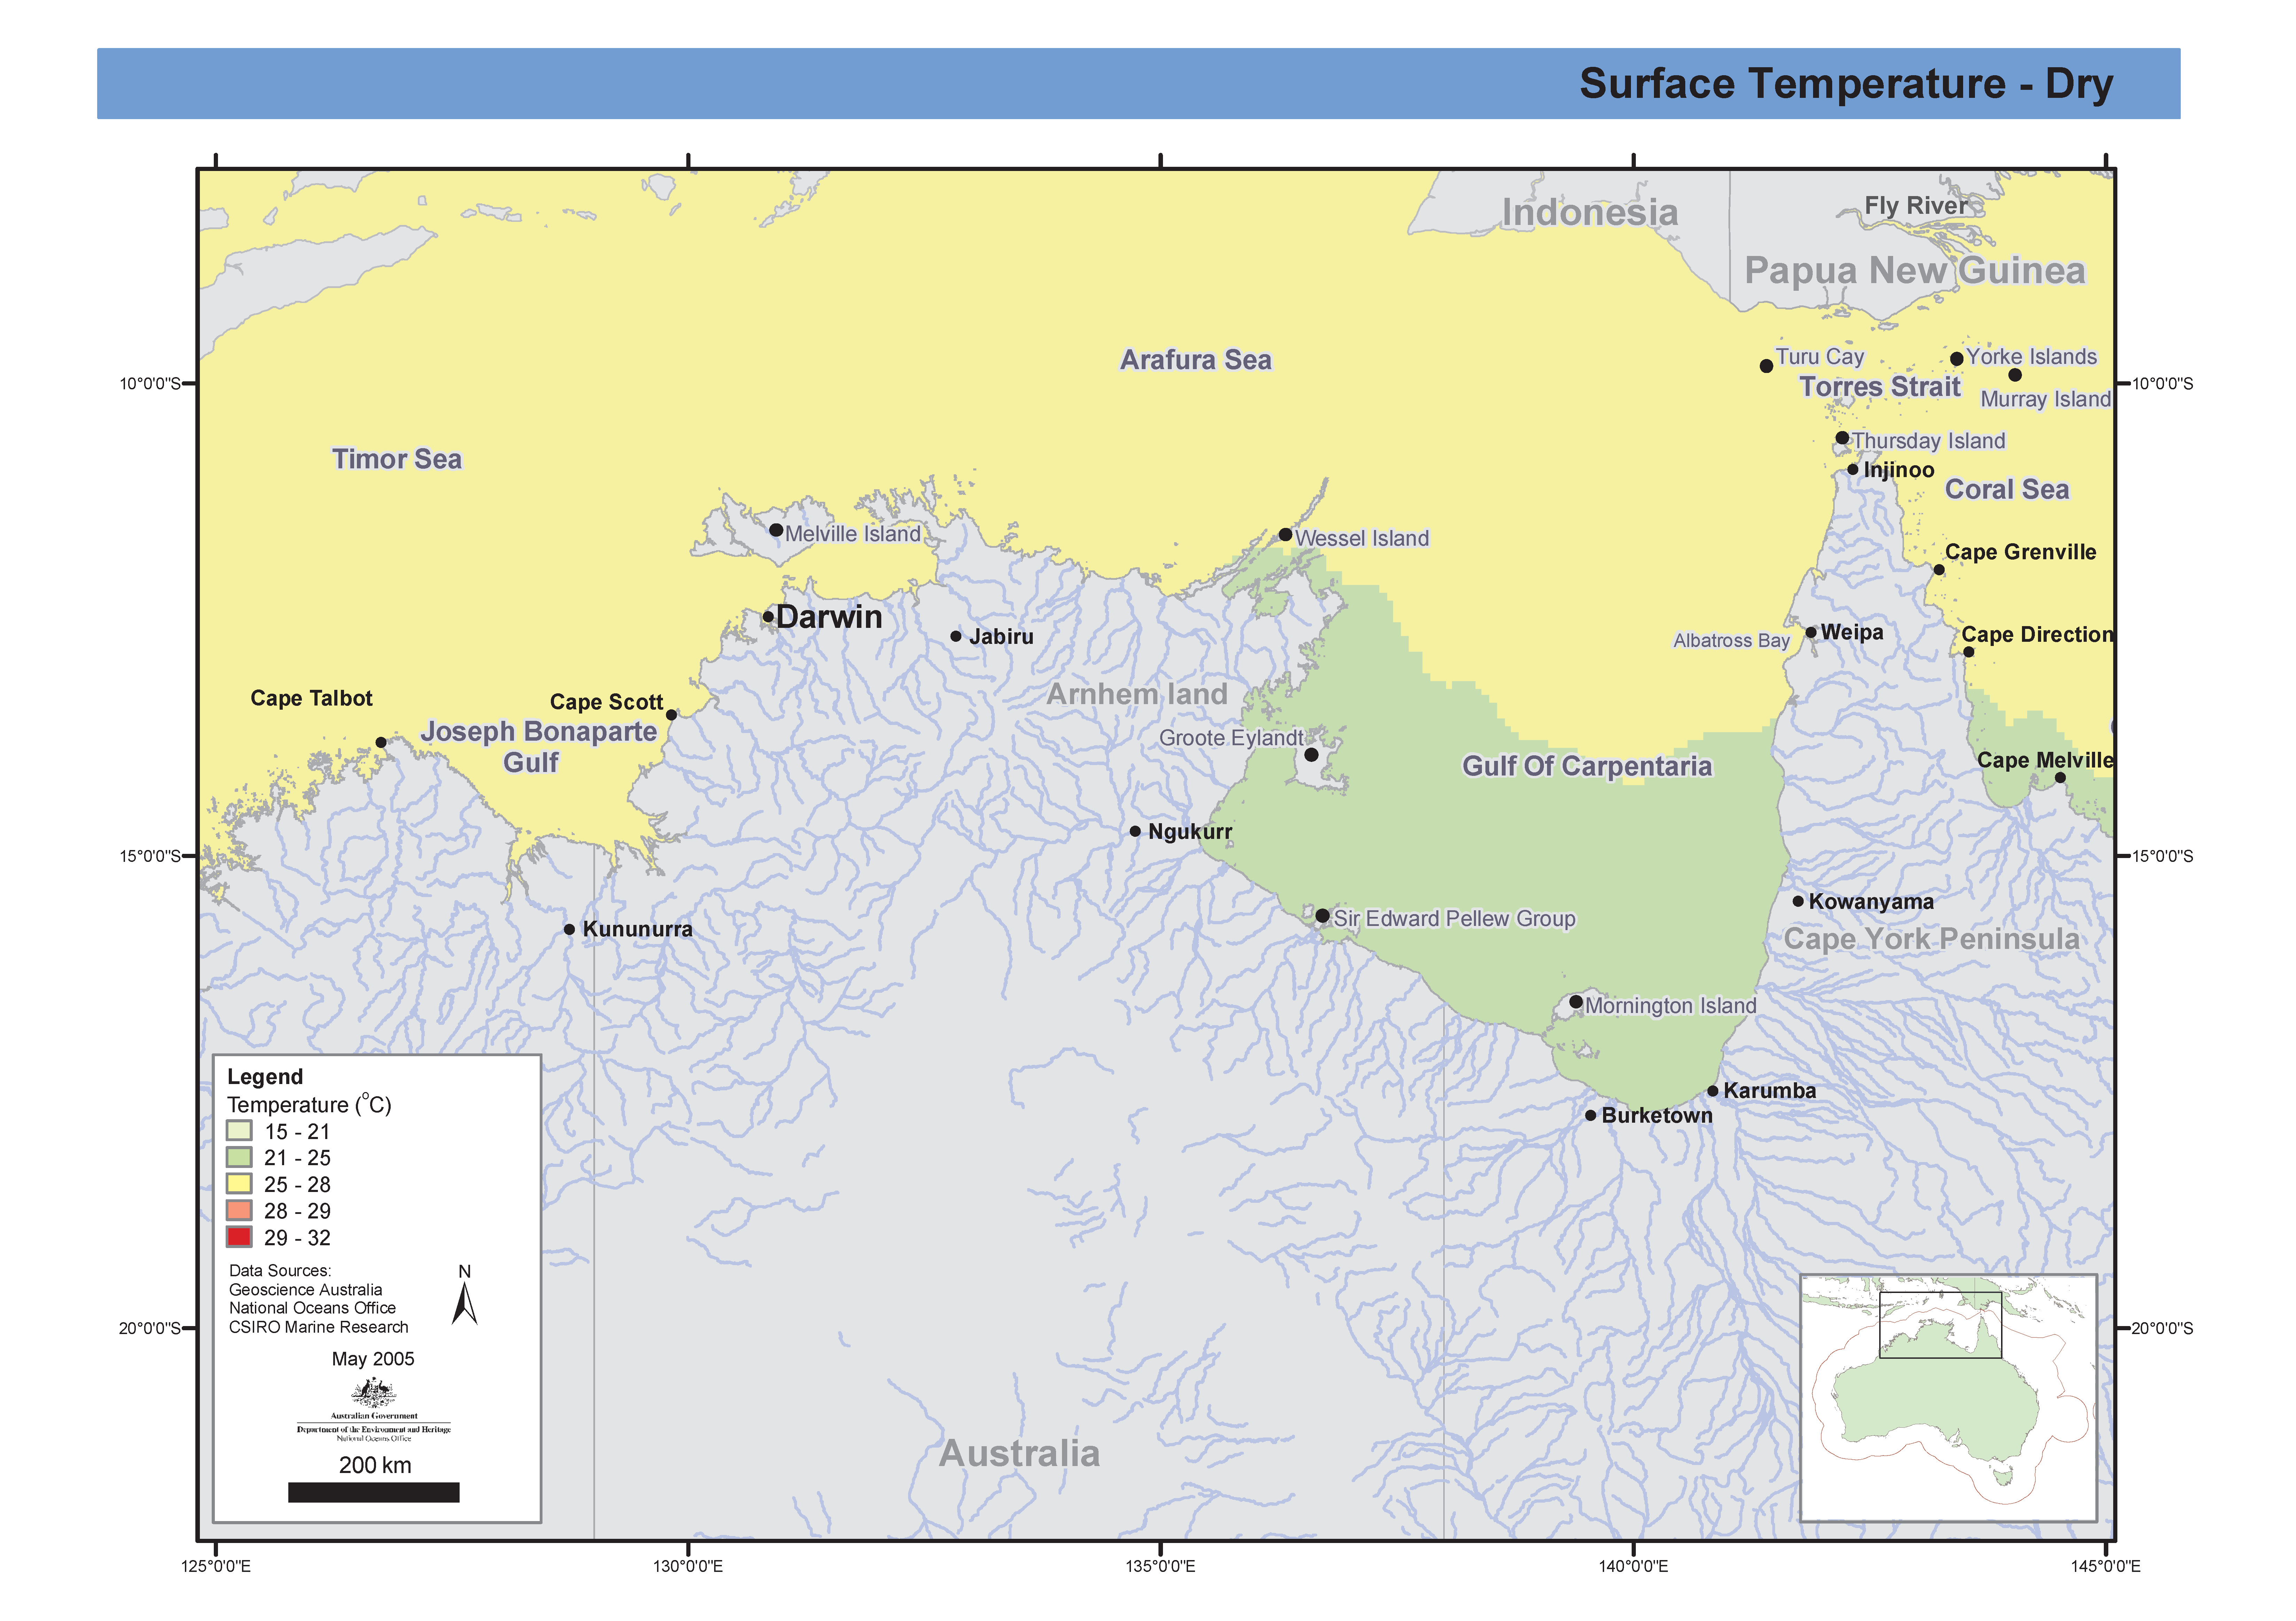
Mapset of sea temperature in the Northern Marine Region produced from CARS2000 mean and seasonal fields 0.1 degree spaced grid. This map has been produced by CSIRO for the National Oceans Office, as part of an ongoing commitment to natural resource planning and management through the 'National Marine Bioregionalisation' project.
-
Temperature, linearly interpolated from CARS2000 mean and seasonal fields to 0.1 degree spaced grid, at depths of 0, 150, 500, 1000 and 2000 metres. The loess filter used to create CARS2000 resolves at each point a mean value and a sinusoid with 1 year period (and in some cases a 6 month period sinusoid - the "semi-annual cycle".) The provided "annual amplitude" is simply the magnitude of that annual sinusoid. CARS is a set of seasonal maps of temperature, salinity, dissolved oxygen, nitrate, phosphate and silicate, generated using Loess mapping from all available oceanographic data in the region. It covers the region 100-200E, 50-0S, on a 0.5 degree grid, and on 56 standard depth levels. Higher resolution versions are also available for the Australian continental shelf. The data was obtained from the World Ocean Atlas 98 and CSIRO Marine and NIWA archives. It was designed to improve on the Levitus WOA98 Atlas, in the Australian region. CARS2000 is derived from ocean cast data, which is always measured above the seafloor. However, for properties which do not change rapidly near the seafloor, this would not lead to a significant error. All the limitations of CARS2000 also apply here.
-
The CSIRO Marine Research Remote Sensing facility automatically receives and archives data from the USA's National Oceanic and Atmospheric Administration (NOAA) satellites. Up to 18 passes per day are tracked to receive data. The Advanced Very High Resolution Radiometer (AVHRR) data is received on the High Resolution Picture Transmission (HRPT) signal. Within an hour of reception, these data are automatically processed into full resolution sea surface temperature (SST) images. This set of data layers have been designed to show regions of core homogeneity, heterogeneity, eddy activity and frontal activity by CSIRO for the National Oceans Office, for the purposes of marine mapping, as part of an ongoing commitment to natural resource planning and management through the 'National Marine Bioregionalisation' project.
-
The CSIRO Marine Research Remote Sensing facility automatically receives and archives data from the USA's National Oceanographic and Atmospheric Administration (NOAA) satellites. Up to 18 passes per day are tracked to receive data. The Advanced Very High Resolution Radiometer (AVHRR) data is received on the High Resolution Picture Transmission (HRPT) signal. Within an hour of reception, these data are automatically processed into full resolution sea surface temperature (SST) images. Raw data originate from the AVHRR sensor on various NOAA polar orbiting satellites, received at various stations around Australia and consolidated ("stitched") by the CSIRO Earth Observation Centre. The stitching removes redundancy and minimises data corruption. Processing from the stitched archive to produce SST is carried out in the CMAR Remote Sensing Facility in Hobart using the split window algorithm of McMillin for NOAA9 and NOAA12 satellites and the NLSST (NOAA non-linear SST) algorithm for the other satellites. Cloud-clearing is performed based on the algorithm of Saunders and Kriebel. Each map is made by combining the estimates over the composite period using a time and spatial neighbourhood median filtering method. Each pixel of the images is the 65 percentile of all cloud-cleared SST estimates during the composite period and within a 4x4 km region. The compositing process also removes most residual cloud contamination. This basedata has been produced by CSIRO for the National Oceans Office, for the purposes of marine mapping, as part of an ongoing commitment to natural resource planning and management through the 'National Marine Bioregionalisation' project. Compositing attempts to overcome the problem of cloud coverage. The compositing technique used here takes the median value of a 4 by 4 neighbourhood of 1km resolution pixels over all the data available for that time period. If there has not been at least one cloud free view of a point on the ground during the composite period, the value recorded may show a false low temperature.
-

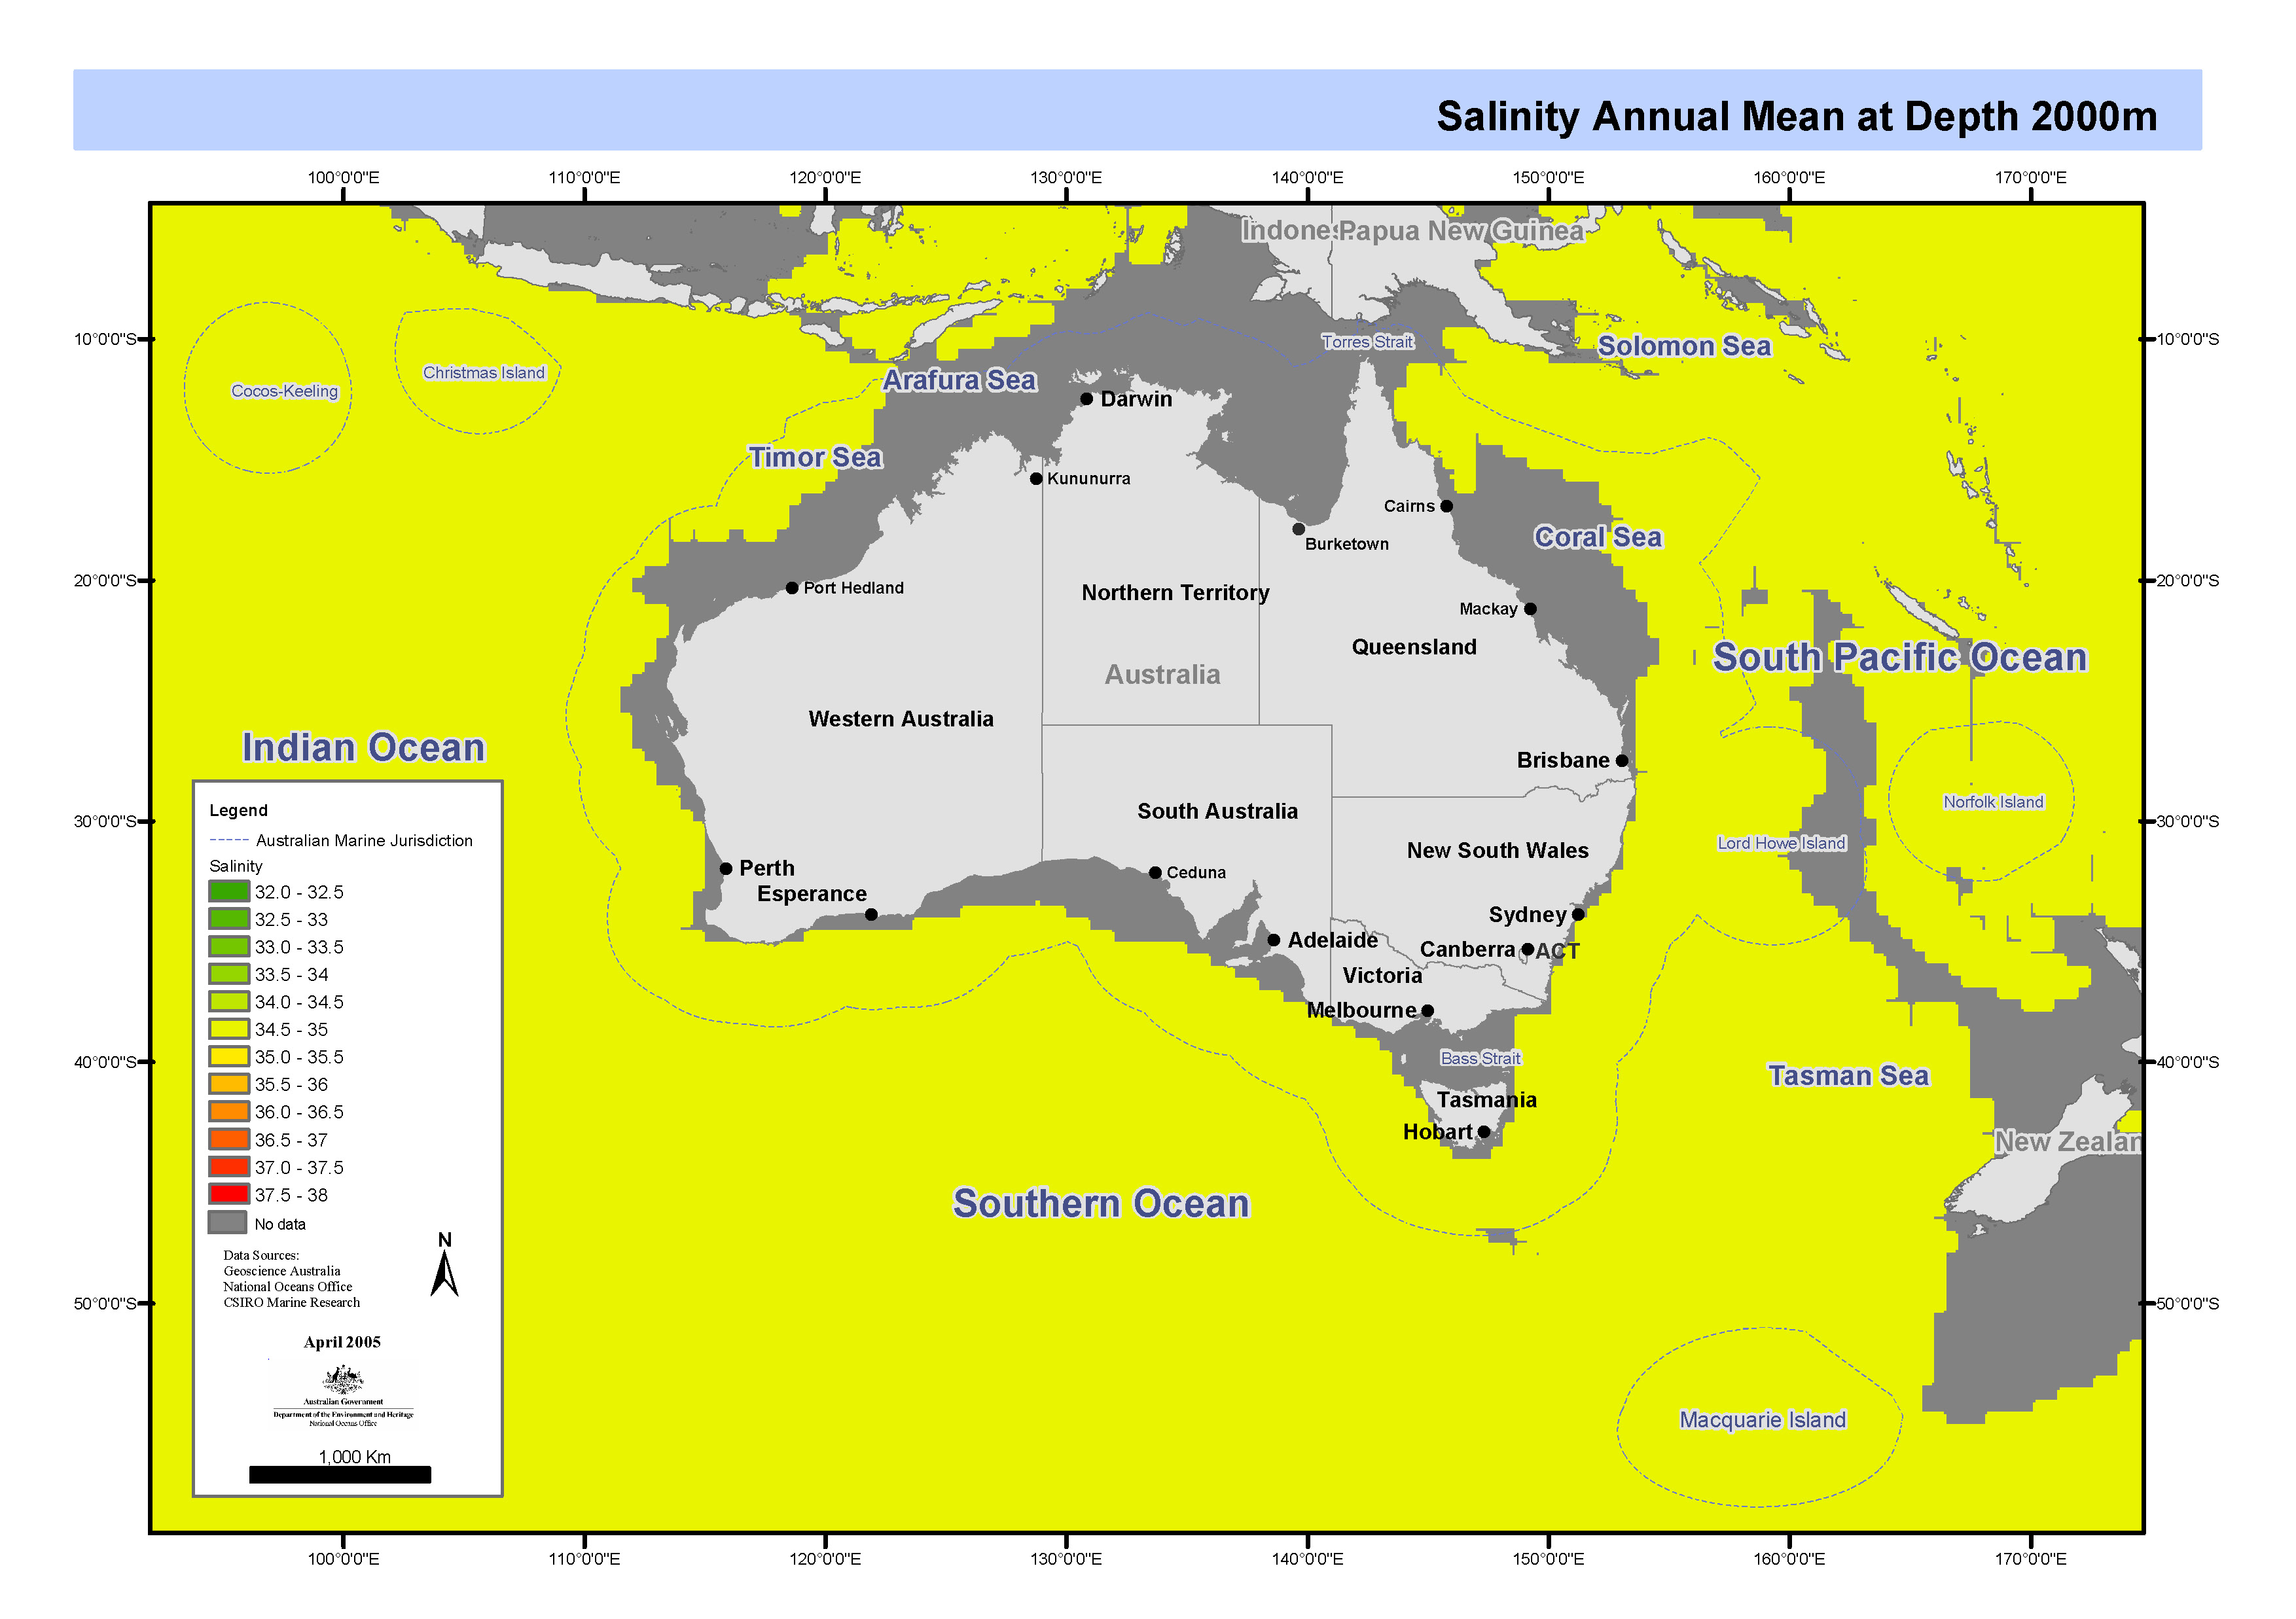
Set of maps showing salinity by depth linearly interpolated from CARS2000 mean and seasonal fields to 0.1 degree spaced grid. These maps form part of a series of maps showing the variation of temperature, salinity, oxygen, silicate, phosphate, and nitrate in Australia's Oceans. Each feature in the series has been separately mapped at depths of 0, 150, 500, 1000 and 2000 metres. These maps have been produced by CSIRO for the National Oceans Office, as part of an ongoing commitment to natural resource planning and management through the 'National Marine Bioregionalisation' project.
-
The eddy-resolving Ocean Forecasting Australia Model (OFAM) is used to downscale future climate projections by CSIRO Mk3.5 climate model under scenario A1B for the 2060s. A simulation run without relaxation and another run with relaxation to expected sea surface temperature and sea surface salinity are archived with 3D fields of ocean temperature, salinity, currents, and sea surface height.
-
The eddy-resolving Ocean Forecasting Australia Model (OFAM) is used to downscale future climate projections by CSIRO Mk3.5 climate model under scenario A1B for the 2060s.
-
OFAM is based on version 4.0d of the Modular Ocean Model, using a hybrid mixed layer model. The horizontal grid has 1191 and 968 points in the zonal and meridional directions respectively; with 1/10 degree horizontal resolution around Australia (90-180E, south of 17). Outside of this domain, the horizontal resolution decreases to 0.9 degrees across the Pacific and Indian basins (to 10E, 60W and 40N) and to 2 degrees in the Atlantic Ocean. OFAM has 47 vertical levels, with 10 m resolution down to 200 m depth. The topography for OFAM is a composite of topography sources including dbdb2 and GEBCO. Horizontal diffusion is zero. Horizontal viscosity is resolution and state-dependent according to the Smagorinsky viscosity scheme (Griffies and Hallberg 2000). BRAN is a multi-year integration of OFAM that assimilates observations using an ensemble optimal interpolation (EnOI) scheme that uses a stationary ensemble of intraseasonal model anomalies, obtained from a non-assimilating model run. Observations include along-track SLA (atSLA) from altimeters and tide gauges, in situ T and S observations and satellite SST.
-
This dataset contains temperature data from the West Indian Ocean. Data (including available XBT data) were collected since 1778. They have been subjected to quality control as an activity of CSIRO and BoM.
