Keyword
Earth Science | Oceans | Ocean Circulation | Advection
8 record(s)
Type of resources
Topics
Keywords
Contact for the resource
Provided by
Formats
Update frequencies
Status
draft
-

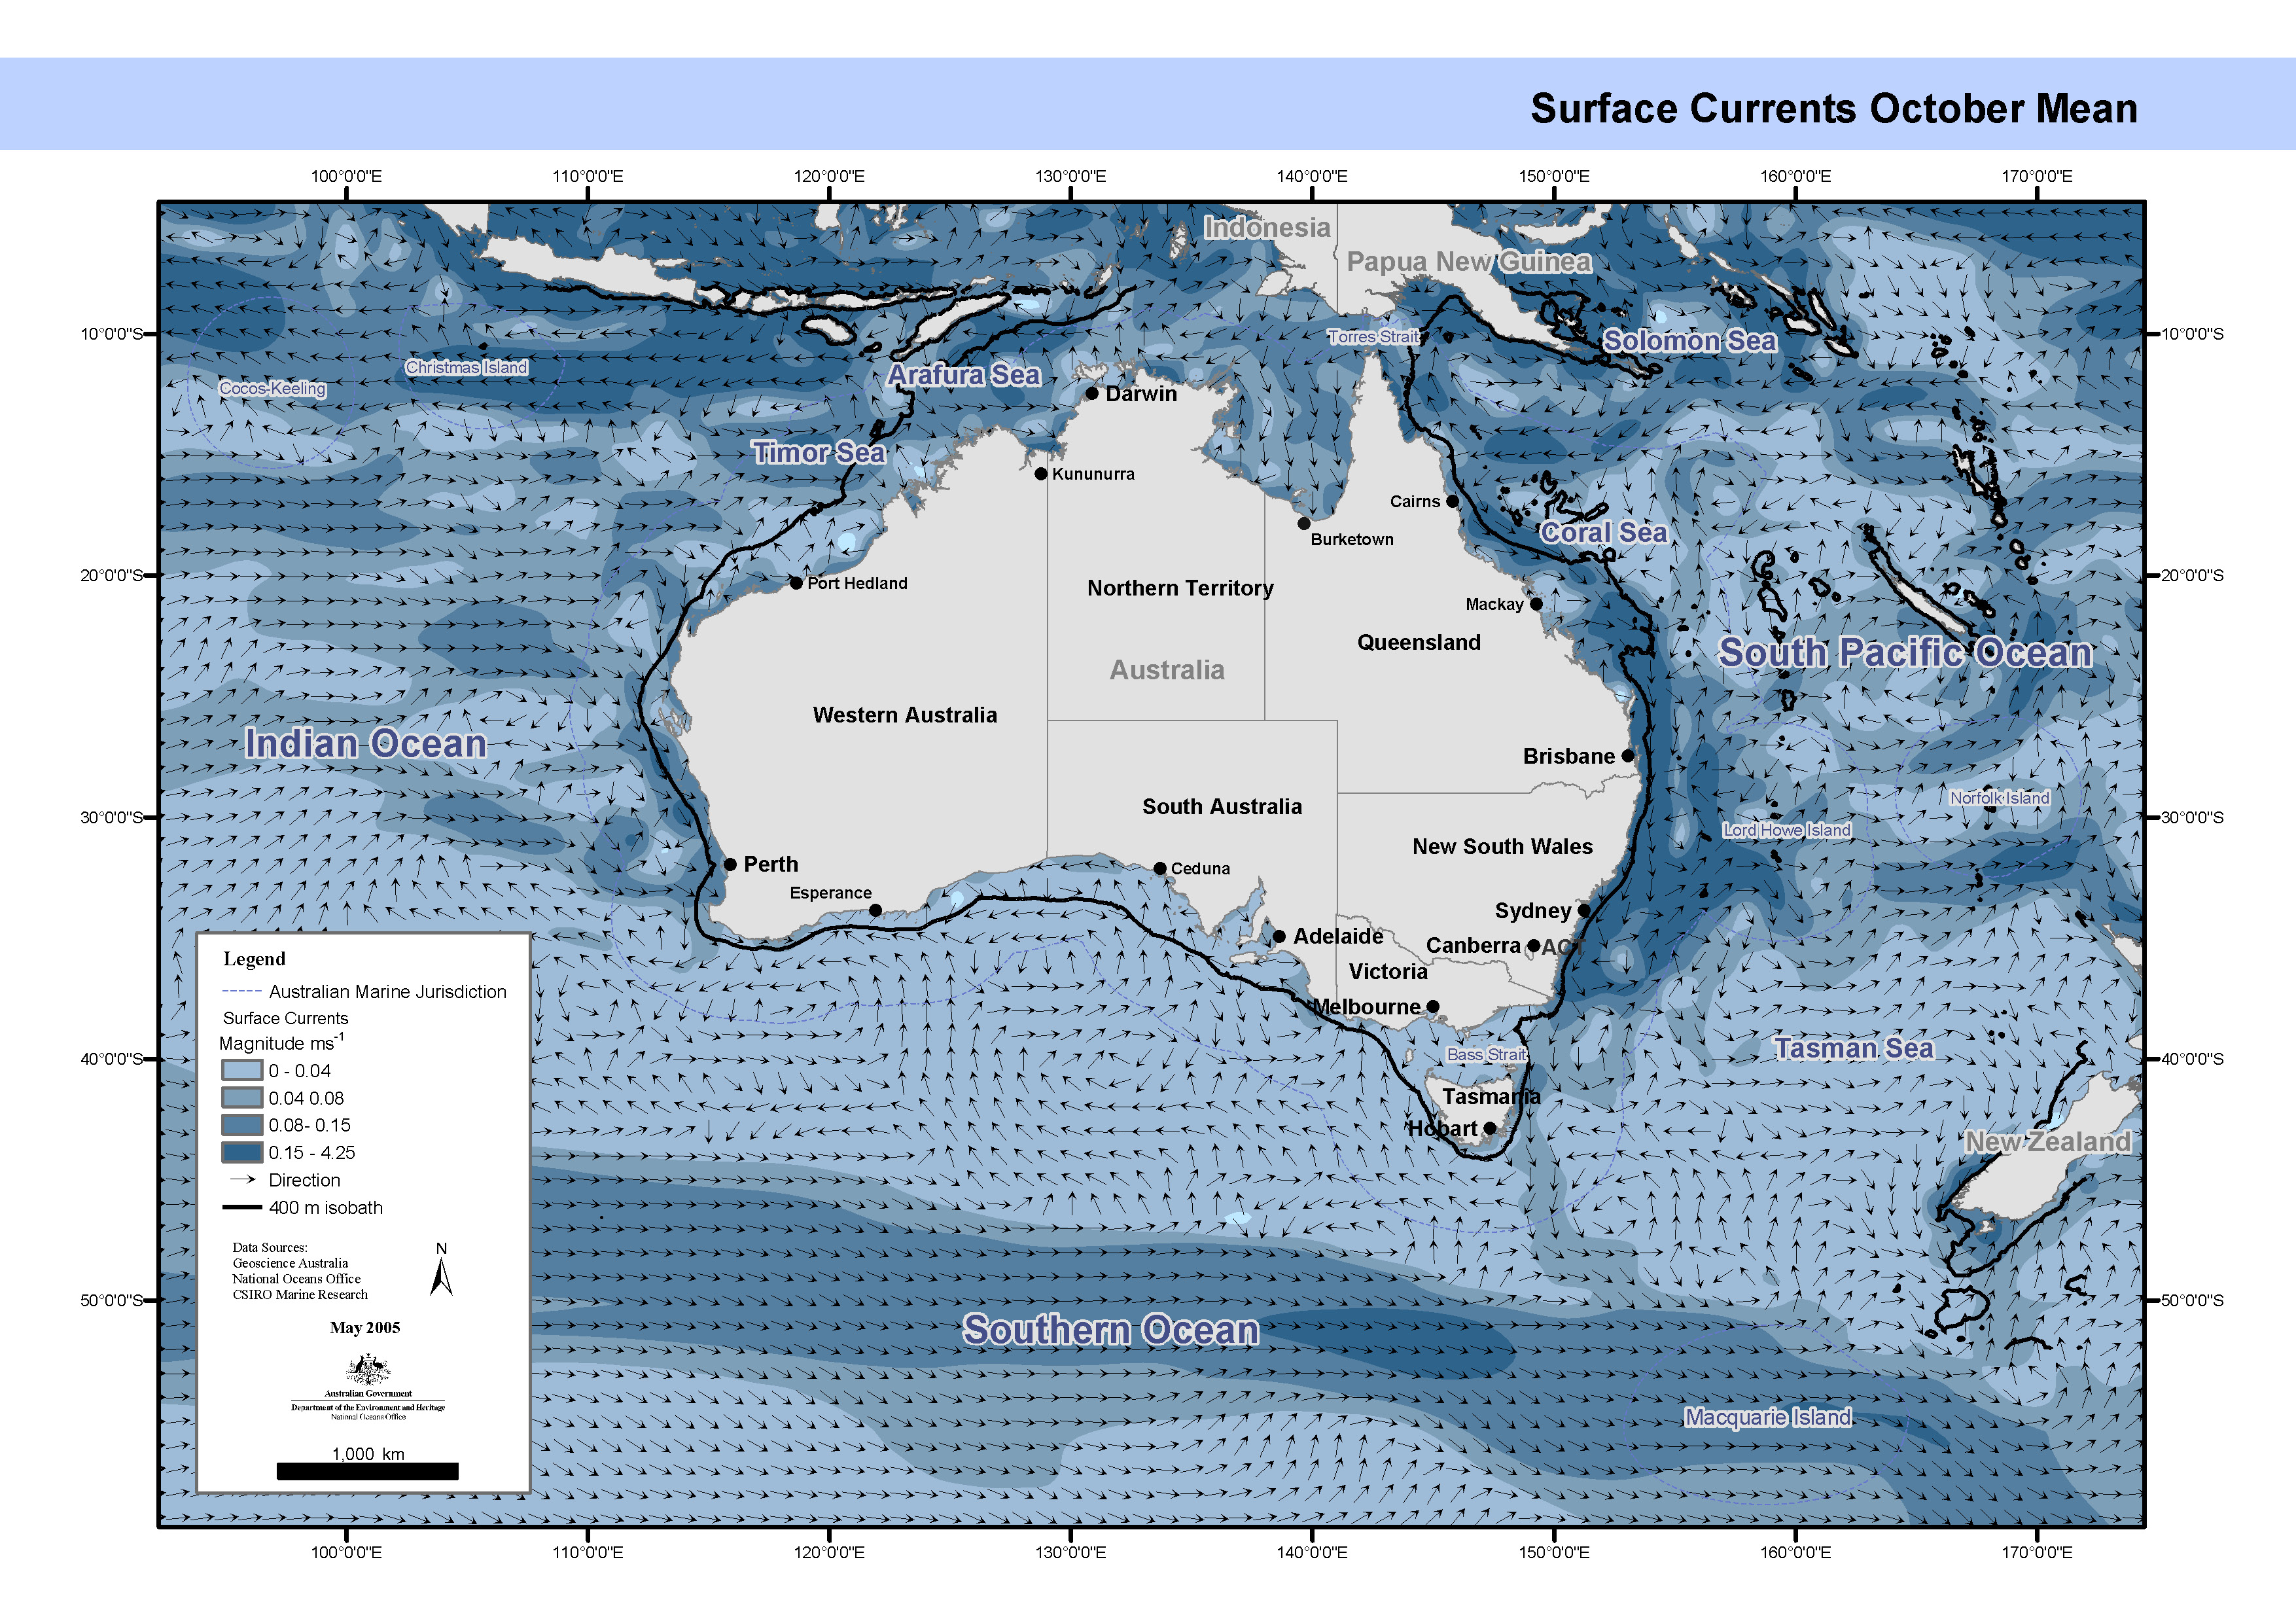
Set of quarterly maps of mean sea surface currents derived from annual and semi-annual temperature and salinity cycles stored in CARS2000. CARS is a set of seasonal maps of temperature, salinity, dissolved oxygen, nitrate, phosphate and silicate, generated using Loess mapping from all available oceanographic data in the region. It covers the region 100-200E, 50-0S, on a 1/2 degree grid, and on 56 standard depth levels. The data was obtained from the World Ocean Atlas 98 and CSIRO Marine and NIWA archives. It was designed to improve on the Levitus WOA98 Atlas, in the Australian region. These maps have been produced by CSIRO for the National Oceans Office, as part of an ongoing commitment to natural resource planning and management through the 'National Marine Bioregionalisation' project. Sea surface height not defined for depths less than 400m. Variations in onscreen colour representation or printed reproduction may affect perception of the contained data.
-
In 1997 and 1998, we tagged and released 18013 red-legged banana prawns in the Joseph Bonaparte Gulf. The location of recaptures was documented for 916 tagged prawns in 1997 and 512 tagged prawns in 1998. Tag recapture information and commercial fishery logbook information was used to test whether red-legged banana prawns moved continuously to deeper waters or whether they moved first to deep water but then returned to shallower waters. The analysis is based on compartment models of recaptures per unit of fishing effort.
-
The Connectivity Interface or "ConnIe" has been developed as a tool for environmental scientists and managers to investigate the patterns of spatial connectivity on Australia's North West Shelf (NWS). Specifically, it provides the user with an estimate of the probability that any two regions are connected by modelled ocean circulation over a specified dispersion period. These connectivity statistics were computed from the paths of neutrally buoyant particles computed from the "Northwest" circulation model (based on MECO), run over the period from 1994 to 1999. The circulation model used a rotated latitude-longitude grid, with a horizontal resolution of approximately 10km and a vertical resolution expanding from 3 m near the surface to a maximum of 200 m at depths below 1000 m. The model was forced by wind fields from the NCEP-NCAR Reanalysis, while temperature and salinity fields around the lateral boundaries were interpolated from a global circulation model known as the Australian Community Ocean Model (ACOM). Sea levels on the boundaries were also taken from the global model output, with the addition of a tidal component derived from a combination of coastal sea level data and output from a global tidal model. ConnIe is expected to find applications in areas such as larval dispersion and recruitment studies, and the development of scenarios and risk assessments for contaminant dispersion.
-
A MATLAB routine (readBRAN) was created to ease accessing the BRAN data for analysis and use. Particle tracking was done using the velocity data in BRAN to investigate the source and sinks of the Leeuwin Current waters.
-
A MATLAB routine (readBRAN) was created to ease accessing the BRAN data for analysis and use. The BRAN model data was compared with the SRFME mooring data to valid the model results.
-
The dataset comprises output from 10 general circulation ocean models contributing to the 4th Assessment Report of the Intergovernmental Panel on Climate Change (IPCC). The models span the globe however a subset encompassing the Indonesian Throughflow and Leeuwin Current region in the East Indian Ocean has been extracted. Ocean horizontal resolutions of the models range from approximately 1 degree to 2.5 degree, and vertical resolutions expand from the surface to their maximum depths. Outputs cover the period from late 1800's to 2100 (2200 for some models) with monthly outputs of zonal and meridioanl current velocity, wind speed and stress of the full 3-dimensional fields.
-
The neutral density code comes as a package of MATLAB and/or FORTRAN routines which enable the user to fit neutral density surfaces to arbitrary hydrographic data. The FORTRAN implementation consists of a FORTRAN subroutine which labels a cast of hydrographic data with neutral density, and another subroutine which then finds the positions of specified neutral density surfaces within the water column. The MATLAB implementation consists of two MATLAB functions performing these same operations, only on sections of hydrographic data. Versions are available for Unix workstations running with the NETCDF data archiving library and PC's not running NETCDF. This latter code is suitable for compilation on Unix workstations or other machines not running the NETCDF library. The MATLAB version for the PC does not require compilation of the underlying FORTRAN code, unlike the UNIX version of the code. All code comes with documentation in the form of Readme files, as well as Makefiles and examples to provide check values for the user. This "in-house" CSIRO software is available under conditions which are attached with the software.
-
WAMSI Node 2.2.1 - An understanding of the mechanism of warming in the tropical eastern Indian Ocean
The CSIRO Mk3 climate system model contains a comprehensive representation of the four major components of the climate system (atmosphere, land surface, oceans and sea-ice), and in its current form is as comprehensive as any of the global coupled models available worldwide. The Mk3 model will be used to investigate the dynamical and physical processes controlling the climate system, for multiseasonal predictions, and for investigations of natural climatic variability and climatic change.
