Keyword
Earth Science | Atmosphere | Atmospheric Winds | Wind Stress
5 record(s)
Type of resources
Topics
Keywords
Contact for the resource
Provided by
Formats
Update frequencies
Status
draft
-
This dataset is the wind driven component of transport in the surface boundary is directed perpendicular to wind stress. Negative wind stress curl indicates the winds are placing a clockwise spin on the ocean surface whereas positive wind stress curl indicates the winds are placing a anti-clockwise spin on the ocean surface. (The curl of a field of vectors is a vector which measures the tendency of the vectors to induce rotation.). Wind curl is calculated for the 23 year period from 1976 to 1998 inclusive. Calculated from NCEP Reanalysis data provided by the NOAA-CIRES Climate Diagnostics Center, Boulder, Colorado, USA, from their Web site at http://www.cdc.noaa.gov/
-
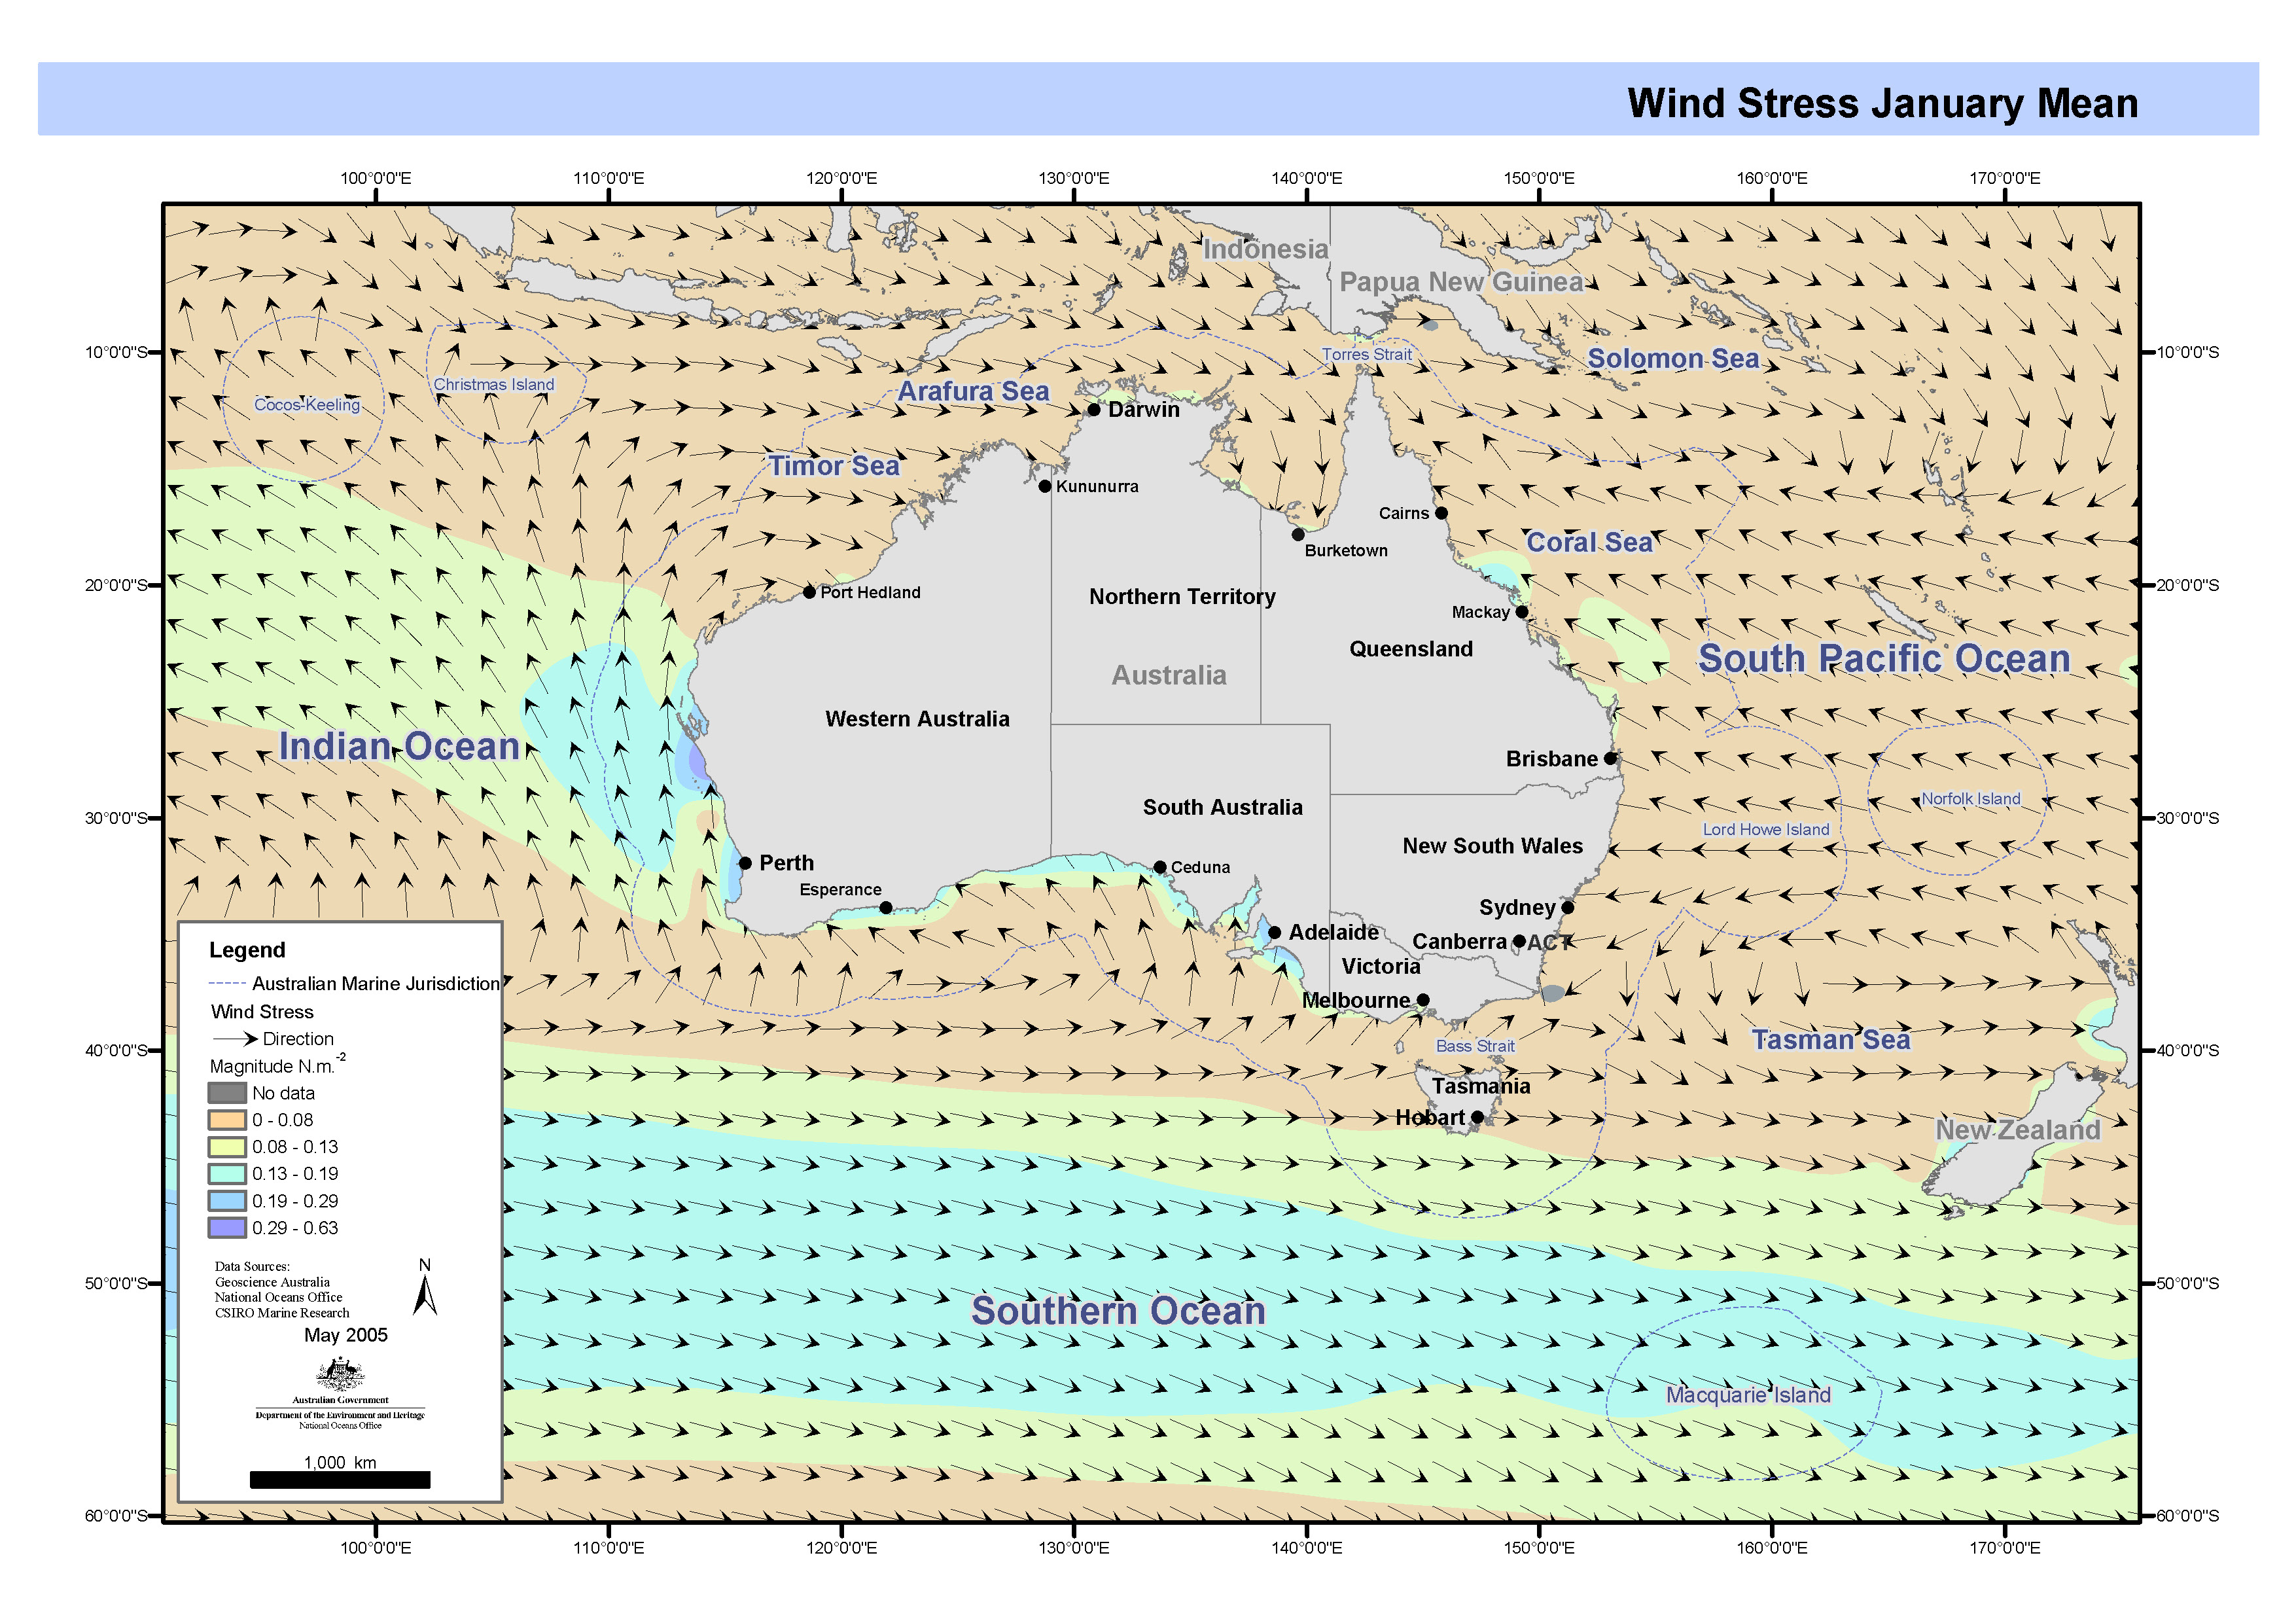
ESRI grid and shape files showing Wind Stress on Australia's oceans from data supplied by the National Centers for Environmental Prediction (NCEP) Re-analysis Project, 1976 to 1998 inclusive. These grid and shape files have been produced by CSIRO for the National Oceans Office, as part of an ongoing commitment to natural resource planning and management through the 'National Marine Bioregionalisation' project. Variations in onscreen colour representation or printed reproduction may affect perception of the contained data.
-
This 'Wind stress of Australia' dataset was derived from global coverage 'netCDF' files produced by the National Centers for Environmental Prediction (NCEP) Re-analysis Project. The means are calculated for the 23 year period from 1976 to 1998 inclusive. The National Center for Environmental Prediction and the National Center for Atmospheric Research are re-analysing the last 40 years of global met. data using present methods to produce a best-possible hindcast of atmospheric conditions through that period. The grid spacing is 1.875 deg Longitude by (about) 1.9 deg Latitude.
-
Maps showing quarterly means of wind curl on Australia's oceans from interpreted basedata supplied by the National Centers for Environmental Prediction (NCEP) Re-analysis Project, 1976 to 1998 inclusive. These maps have been produced by CSIRO for the National Oceans Office, as part of an ongoing commitment to natural resource planning and management through the 'National Marine Bioregionalisation' project.
-

Maps showing quarterly means of wind stress on Australia's oceans from data supplied by the National Centers for Environmental Prediction (NCEP) Re-analysis Project, 1976 to 1998 inclusive. This map has been produced by CSIRO for the National Oceans Office, as part of an ongoing commitment to natural resource planning and management through the 'National Marine Bioregionalisation' project.
